River
Jinsha River
3,005 km from source to mouth · China.
 ChinaFlows into Yangtze River3rd longest in China
In numbers
Length
3,005km
Average flow
4,500m³/s
Basin
471,454km²
Drop
4,220m
from 4,472 m to 252 m
Country
1
The journey
From source to mouth
3,005 km of river and 29 stops on the way: 7 towns and cities on its banks, dams, bridges and the tributaries that feed it.
- 0 kmTongtian Riverat 4,472 m
- 1,342 kmHelong bridge
- 1,451 kmJudian21,368 people
- 1,510 kmShigu21,006 people
- 1,549 kmHutiaoxia Jinshajiang Bridge
- 1,755 kmJin'an Bridge
- 1,763 kmJinlong Bridge
- 1,849 kmTaoyuan34,655 people
- 1,855 kmTaoyuan Jinsha River Bridge
- 1,992 kmBaodin bridge
- 1,995 kmFala bridge
- 2,003 kmXinzhuang bridge
- 2,003 kmpipeline bridge crosstin the Jinsha River in Panzhihua
- 2,005 kmHehuachi bridge
- 2,009 kmDukou bridge
- 2,011 kmBingcaogang Bridge
- 2,013 kmPanzhihua787,177 people
- 2,017 kmMidi bridge
- 2,022 kmLuoguo bridge
- 2,022 kmQinglongshan Bridge
- 2,023 kmYalong Rivertributary
- 2,027 kmJinshajiang Bridge of Chengkun Railway
- 2,246 kmPudu Hetributary
- 2,347 kmHulukou Bridge
- 2,348 kmChuandian Jinsha River Bridge
- 2,639 kmXindu Jinsha River Bridge
- 2,706 kmShuifu102,143 people
- 2,723 kmBaixi88,251 people
- 2,732 kmZhongba bridge
- 2,735 kmYibin4,887,242 people
- 3,005 kmYangtze Riverat 252 m
Water level along the river (RiverATLAS; the height is exaggerated). Towns: GeoNames and Wikidata; bridges, dams and tributaries: Wikidata.
River in the People's Republic of China, the upper course of the Yangtze
At the mouth it carries 4,471 m³/s on average: 1.8 Olympic pools every second. It drops from 4,472 m to 252 m, 1.4 m per kilometre on average. Its basin covers 471,454 km², about the size of CM. 23.1 million people live in it. Highest water: from August to September; lowest: from January to April. Its dams hold back little of its water (5.2% of a year's flow).
Where to start
- YibinLargest city on its banks · 4,887,242 people
- Yibin Wuliangye Airport (YBP)Nearest airport with scheduled flights, 16 km from the city
- On the water32 ferry piers, marinas, boat rentals and boat ramps along the river (OpenStreetMap)
- May and SeptemberThe best months to visit
Jinsha River, month by month
Highest water: from August to September
Lowest water: from January to April. Best months to visit: May and September.
From about 1,100 m³/s in the lowest month to 12,400 m³/s in the highest. An estimate: the monthly flow is modelled from the lowest and highest months of WaterGAP (RiverATLAS, 1971–2000) and the rain and snow along the river (WorldClim). Dams change the real rhythm. The chip is the average air temperature; below it, the month's rain.
Plan the trip
Plan the trip: boat trips, a bed by the river, a car
Some links above are affiliate links: if you book through them we may earn a commission, at no extra cost to you. It never changes what the data on this page says.
The basin
Jinsha River: the basin in numbers
471,454 km² of land send their water to this river. This is what lives on it.
- 23.1millionpeople live in the basin
- 49/km²people per km²
- 3,716maverage altitude of the basin
- 660mmof rain a year (basin average)
- 3.6°Caverage air temperature
- 39%protected areas
- 0.3%covered by lakes
- 24%permafrost
- 8.4km³held in reservoirs
What covers the basin
- 28% Forest
- 5% Cropland
- 51% Pasture
- 1% Towns and cities
RiverATLAS (HydroATLAS v1.0, CC BY 4.0): land cover, people, protected areas, glaciers and dams over the whole basin upstream of the mouth.
Along the river
Jinsha River: what you find on the way
- 5Weirsplunge pool weir and 4 more
- 9WaterfallsWaterfall (small) and 8 more
- 1Boat ramps
- 26Ferry piers
- 5MarinasShigu Pier and 4 more
From OpenStreetMap, within 2.8 km of the river. Not mapped is not the same as not there.
From space
The source and the mouth, seen from orbit
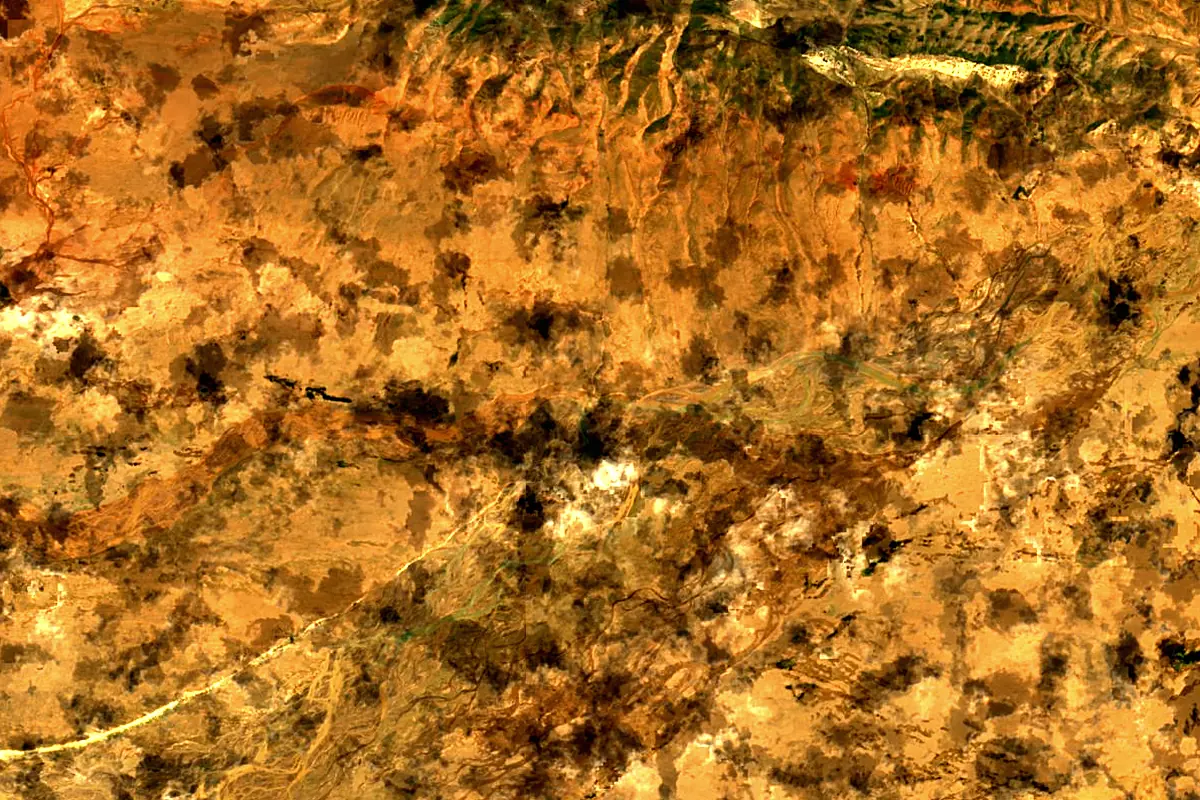
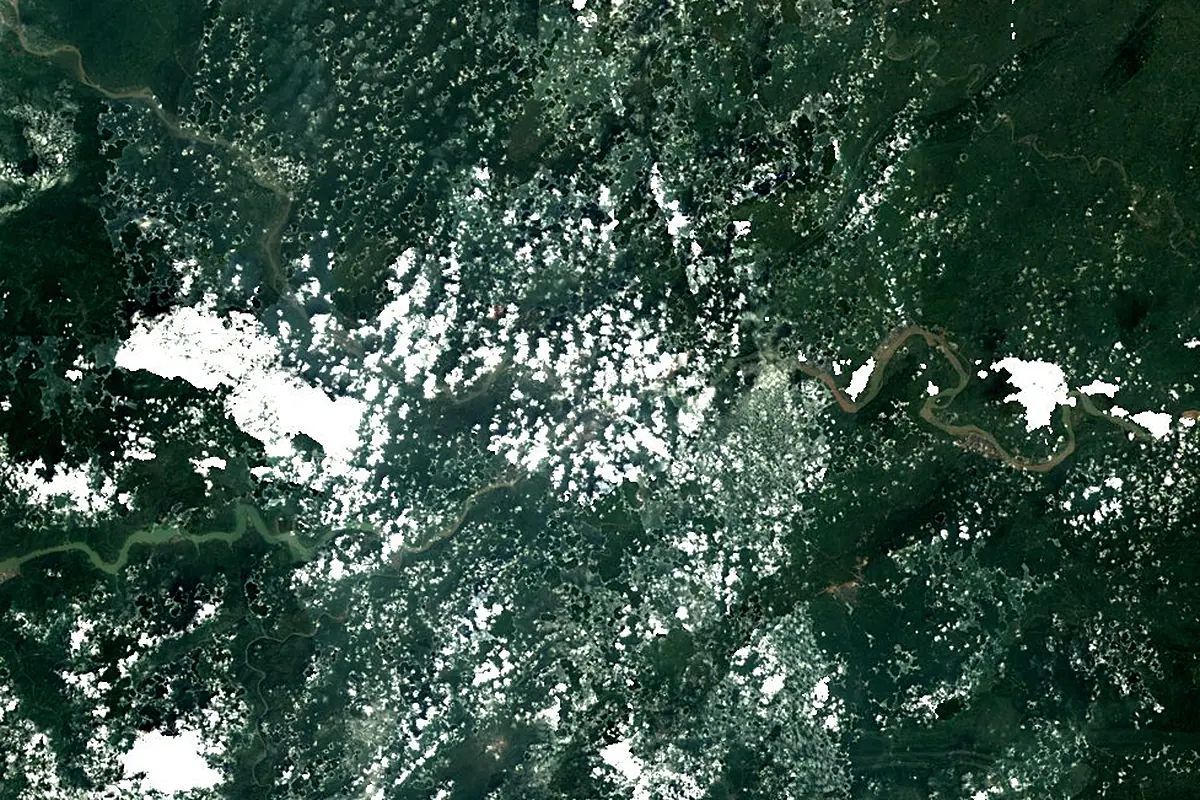
Sentinel-2 cloudless 2016 by EOX IT Services GmbH (contains modified Copernicus Sentinel data 2016), CC BY 4.0. The glowing line is the river as drawn by RiverATLAS.
Photos
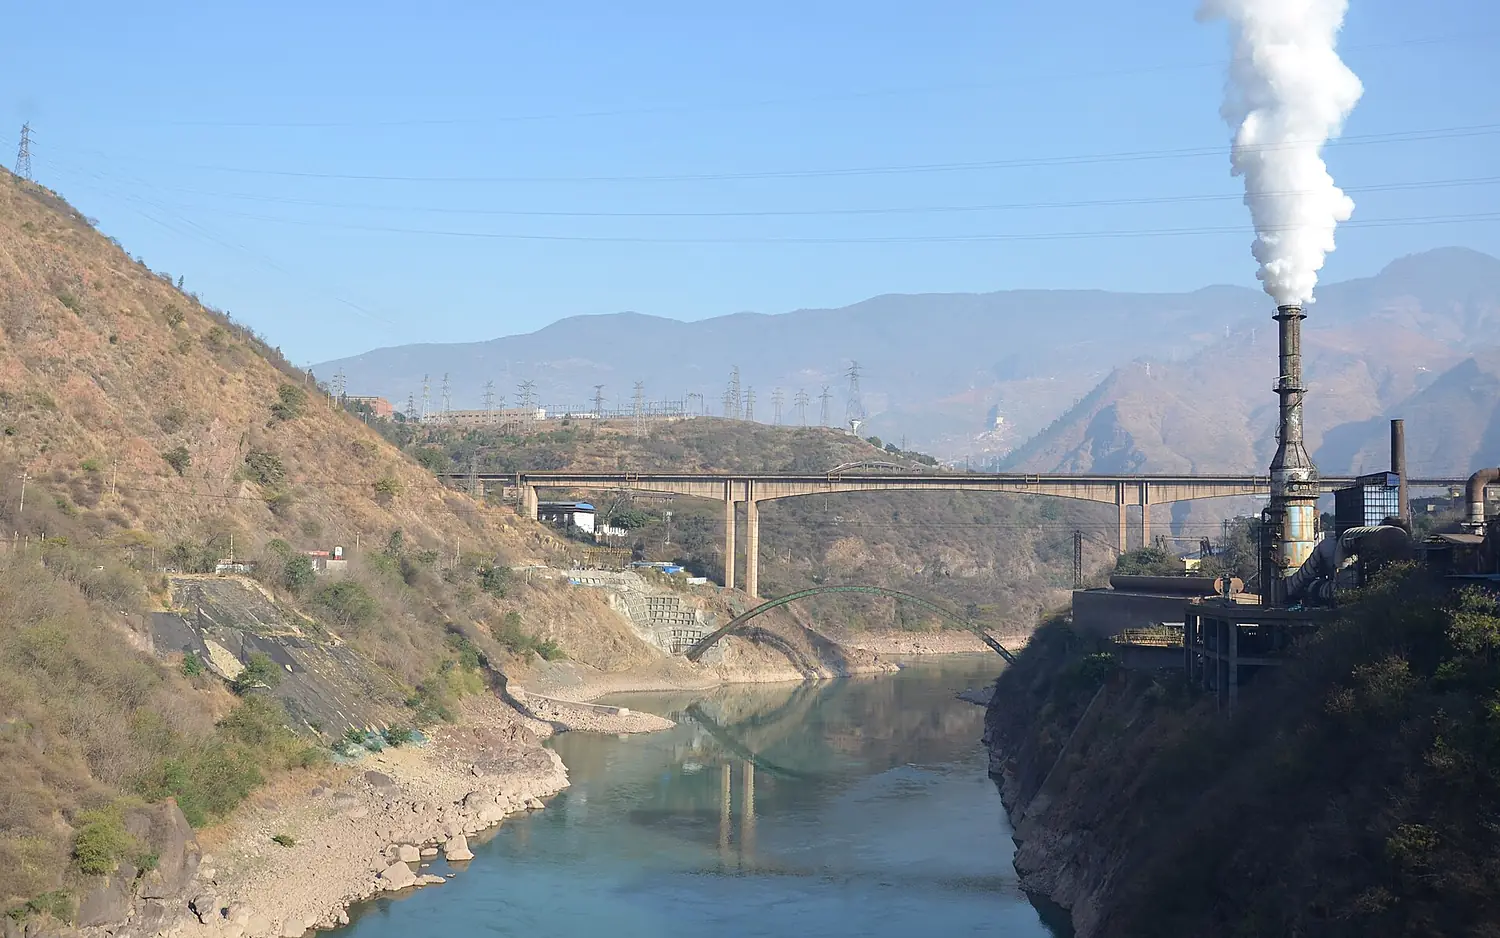
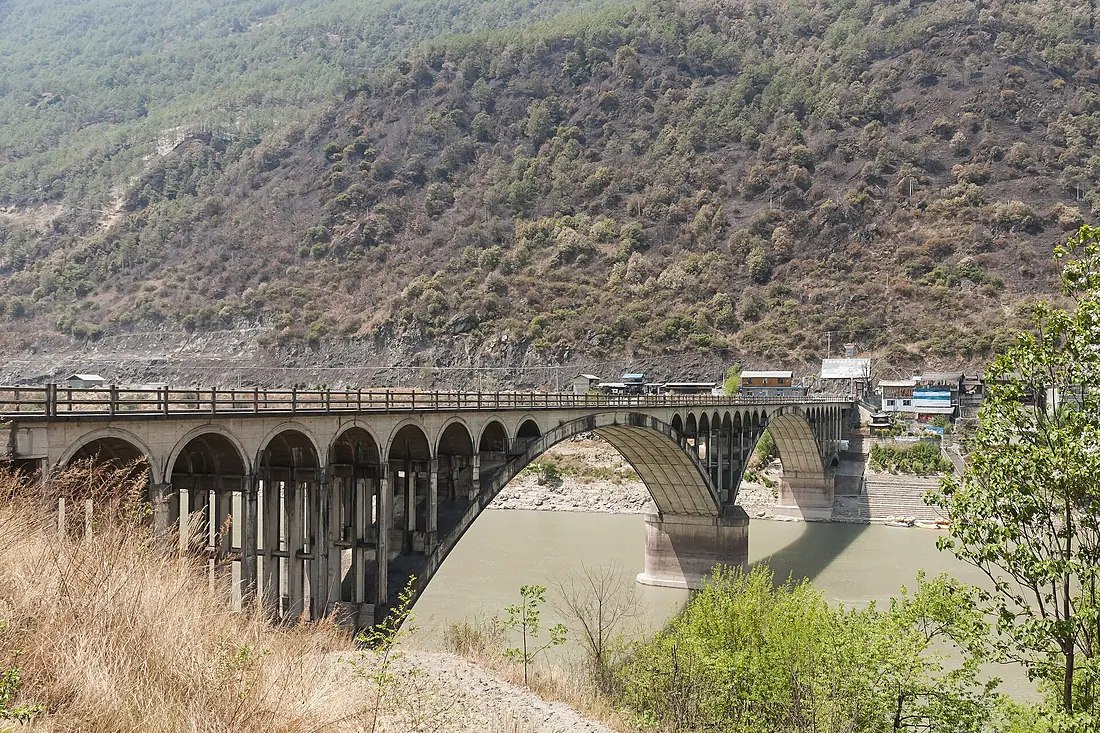
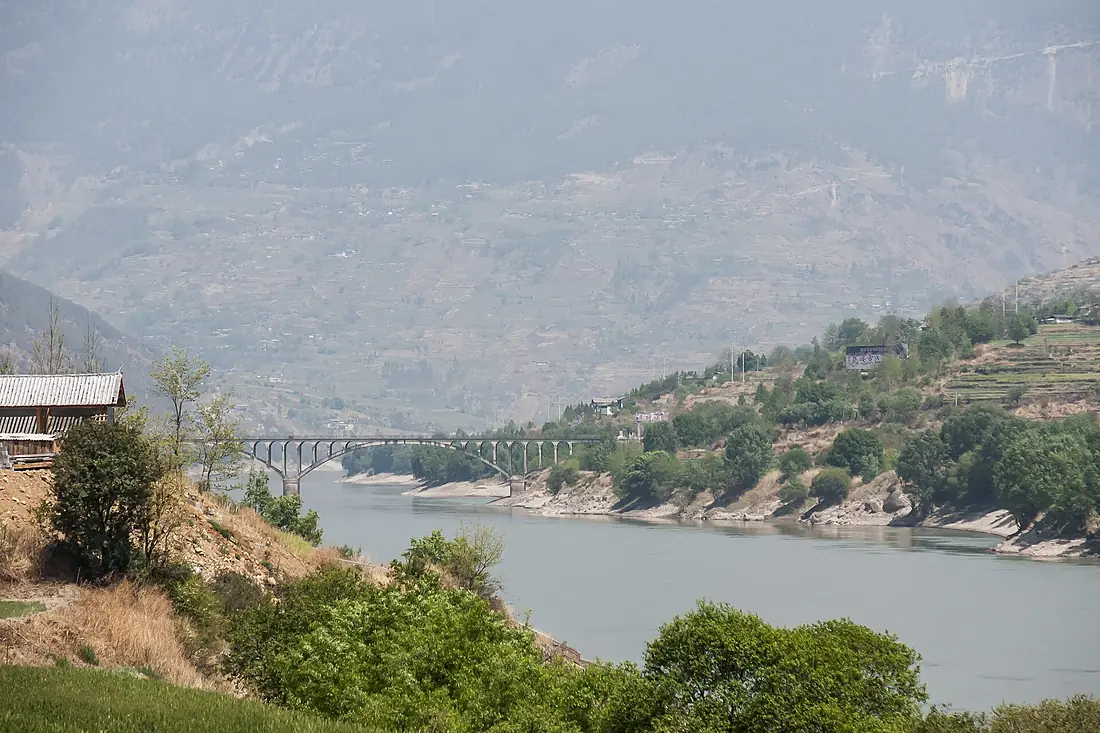
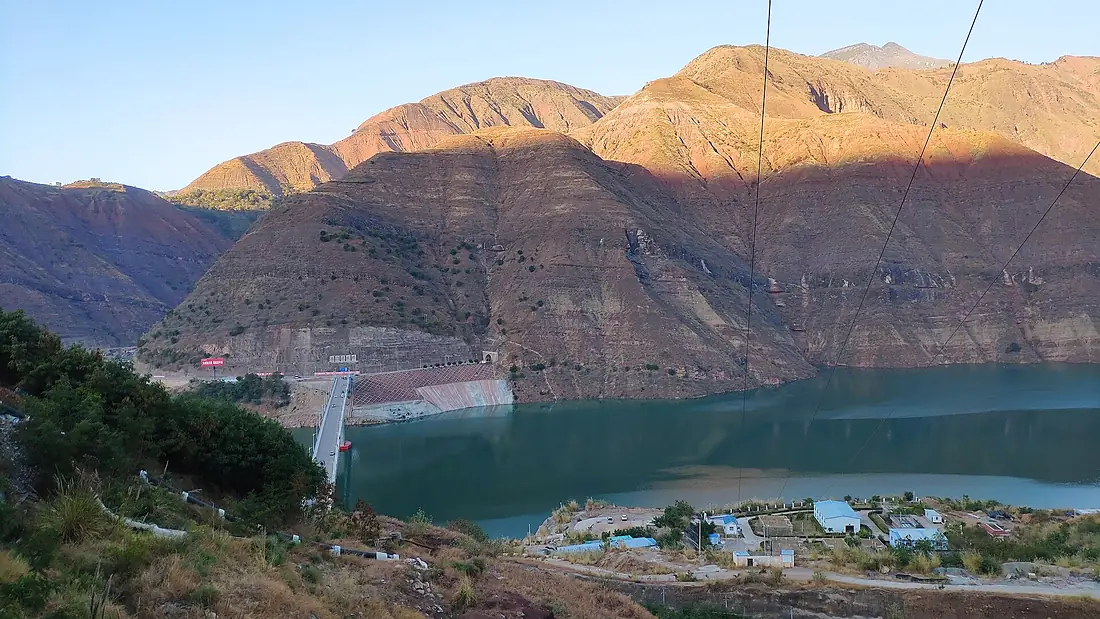
Jinsha River in pictures
Tributaries
Where it flows, and what flows into it
It flows into
Yangtze RiverChina6,300 km31,900 m³/sTributaries (6)
Also: Pudu He, Tongtian River, Niulan (rivière), Heishui River, Xoi Qu
In the same basin
China1,532 km2,200 m³/sHuai RiverChina1,110 km1,200 m³/sGan RiverChina758 km1,700 m³/sJialing RiverChina1,119 km2,100 m³/sWu RiverChina1,150 km1,800 m³/sXiang RiverChina801 km6,400 m³/sMin RiverChina711 km2,300 m³/sYuan RiverChina993 km2,000 m³/sDadu RiverChina642 km1,400 m³/sTuo RiverChina655 km460 m³/sWhere these numbers come from
| Name, length, places | Wikidata (Q1038418) · CC0 |
|---|---|
| Course, profile, basin | RiverATLAS v1.0 (HydroATLAS, Linke et al. 2019) · CC BY 4.0 — followed from the source to the mouth given by Wikidata |
| Flow | WaterGAP (RiverATLAS), 1971–2000 · CC BY 4.0 |
| Climate along the river | WorldClim (RiverATLAS), 1970–2000 · CC BY 4.0 |
| Towns, bridges, dams | Wikidata · CC0; GeoNames · CC BY 4.0 |
| Along the river | © OpenStreetMap contributors · ODbL |
| Images | EOX Sentinel-2 cloudless 2016 · CC BY 4.0; Wikimedia Commons |
Every source and licence is on the data sources page.
The family
Do you prefer beaches, lakes, mountains, waterfalls, islands, rivers or canyons?
Same idea, other landscapes: field atlases built on open data, month by month, in seven languages.
 beaches
 Find your beach: sea temperature, sun and swimming month by month.Visit
  lakes
lakes Every lake on Earth: water temperature, ice, depth and the shore.Coming soonVisit
  mountains
 Every summit in 3D: summit weather, the 0 °C line, huts and trails.Visit
  waterfalls
 Every waterfall: height, flow month by month and when it roars.Coming soonVisit
  islands
 Every island from the sea up: size, sea temperature, ferries and 3D.Coming soonVisit
  rivers
 Every river from source to sea: the journey, the flow and the basin in numbers.You are here
 canyons
 Every canyon cut to scale: depth to the floor, rim and floor temperatures, trails and viewpoints.Coming soonVisit