River
Red River
1,149 km from source to mouth · Vietnam and China.

 Vietnam and ChinaFlows into Gulf of Tonkin2nd longest in Vietnam
In numbers
Length
1,149km
Average flow
900m³/s
Basin
158,000km²
Drop
1,473m
from 1,473 m to 0 m
Countries
2
The journey
From source to mouth
1,149 km of river and 40 stops on the way: 34 towns and cities on its banks, dams, bridges and the tributaries that feed it.
- 0 kmYunnanat 1,473 m
- 641 kmÍt Ong16,153 people
- 818 kmHòa Bình105,260 people
- 846 kmXuân Trùng11,506 people
- 854 kmTrại Khoai11,833 people
- 873 kmBlack Rivertributary
- 874 kmCổ Đô70,706 people
- 879 kmViệt Trì415,280 people
- 884 kmLô Rivertributary
- 892 kmTây Đằng12,877 people
- 898 kmĐường Lâm8,329 people
- 901 kmSơn Tây230,577 people
- 926 kmThượng Cát87,406 people
- 927 kmTây Tựu39,436 people
- 930 kmĐông Ngạc83,544 people
- 931 kmThụy Phương13,676 people
- 934 kmPhú Thương39,322 people
- 935 kmNhật Tân Bridge
- 935 kmTây Hồ168,300 people
- 936 kmWest Lake5.7 km²
- 941 kmBa Dinh221,893 people
- 941 kmBồ Đề120,028 people
- 942 kmYên Phụ23,942 people
- 942 kmLong Bien Bridge
- 943 kmChương Dương Bridge
- 944 kmHoàn Kiếm135,618 people
- 944 kmHanoi8,053,663 people
- 944 kmCửa Nam52,750 people
- 945 kmHoang Cau18,500 people
- 945 kmNguyễn Du10,078 people
- 945 kmHai Bà Trưng303,586 people
- 946 kmTương Mai136,292 people
- 946 kmVinhomes Times City50,000 people
- 947 kmQuỳnh Lôi14,970 people
- 947 kmLong Bien347,829 people
- 947 kmVĩnh Tuy86,618 people
- 952 kmEcopark25,000 people
- 952 kmLĩnh Nam20,706 people
- 957 kmNgọc Hồi13,453 people
- 1,000 kmHưng Yên118,646 people
- 1,039 kmNam Định448,225 people
- 1,149 kmGulf of Tonkinat 0 m
Water level along the river (RiverATLAS; the height is exaggerated). Towns: GeoNames and Wikidata; bridges, dams and tributaries: Wikidata.
River in southwest China and northern Vietnam
At the mouth it carries 900 m³/s on average: an Olympic pool every 2.8 seconds. It drops from 1,473 m to 0 m, 1.3 m per kilometre on average. Its basin covers 158,000 km², about the size of SR. 17.6 million people live in it. Highest water: from August to September; lowest: from January to April. Dams and reservoirs hold back a large share of its water (12% of a year's flow).
Where to start
- HanoiLargest city on its banks · 8,053,663 people
- Noi Bai International Airport (HAN)Nearest airport with scheduled flights, 22 km from the city
- On the water34 ferry piers, marinas, boat rentals and boat ramps along the river (OpenStreetMap)
- From November to MarchThe best months to visit
Red River, month by month
Highest water: from August to September
Lowest water: from January to April. Best months to visit: from November to March.
From about 690 m³/s in the lowest month to 9,000 m³/s in the highest. An estimate: the monthly flow is modelled from the lowest and highest months of WaterGAP (RiverATLAS, 1971–2000) and the rain and snow along the river (WorldClim). Dams change the real rhythm. The chip is the average air temperature; below it, the month's rain.
Plan the trip
Plan the trip: boat trips, a bed by the river, a car
Some links above are affiliate links: if you book through them we may earn a commission, at no extra cost to you. It never changes what the data on this page says.
The basin
Red River: the basin in numbers
138,848 km² of land send their water to this river. This is what lives on it.
- 17.6millionpeople live in the basin
- 130/km²people per km²
- 1,123maverage altitude of the basin
- 1,435mmof rain a year (basin average)
- 19.3°Caverage air temperature
- 7%protected areas
- 0.2%covered by lakes
- 12km³held in reservoirs
What covers the basin
- 15% Forest
- 13% Cropland
- 20% Pasture
- 4% Towns and cities
RiverATLAS (HydroATLAS v1.0, CC BY 4.0): land cover, people, protected areas, glaciers and dams over the whole basin upstream of the mouth.
Along the river
Red River: what you find on the way
- 9Weirs
- 2Locks
- 3Waterfalls
- 33Ferry piersBến Tây Đằng, Bến Đò Sơn Tây, Bến Phà and 30 more
- 1MarinasBến tàu Trúc Bạch
- 1River beachesRed River Beach
From OpenStreetMap, within 2.5 km of the river. Not mapped is not the same as not there.
Cross-checked with our atlases
Red River in our other atlases
What our sister atlases know about the waterfalls on this river, the lakes it flows through, the beaches at its mouth, the mountains where it rises and the islands off its mouth.
 1lake on its wayLakeyas
Lakes and reservoirs (1)
Lakes it flows through, by Lakeyas
- West Lakekm 9665.7km²
Lakeyas is coming soonOpen Lakeyas ↗
From space
The source and the mouth, seen from orbit
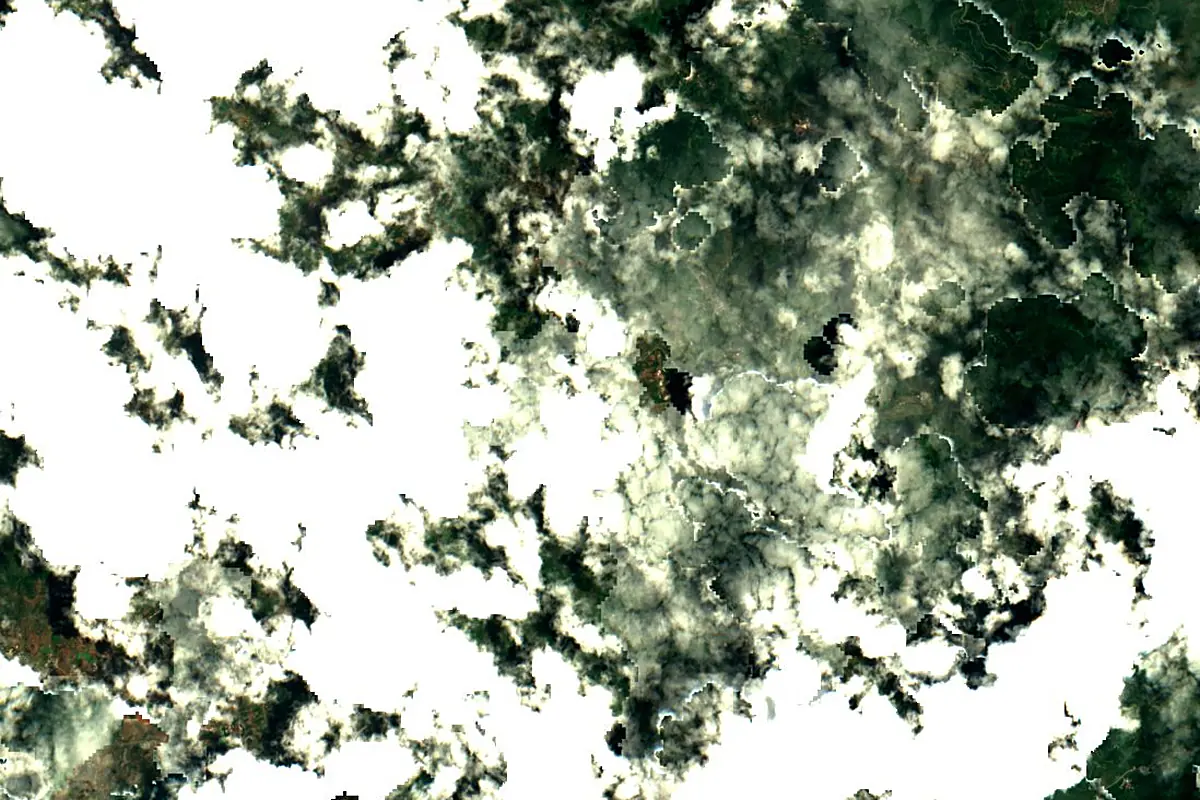
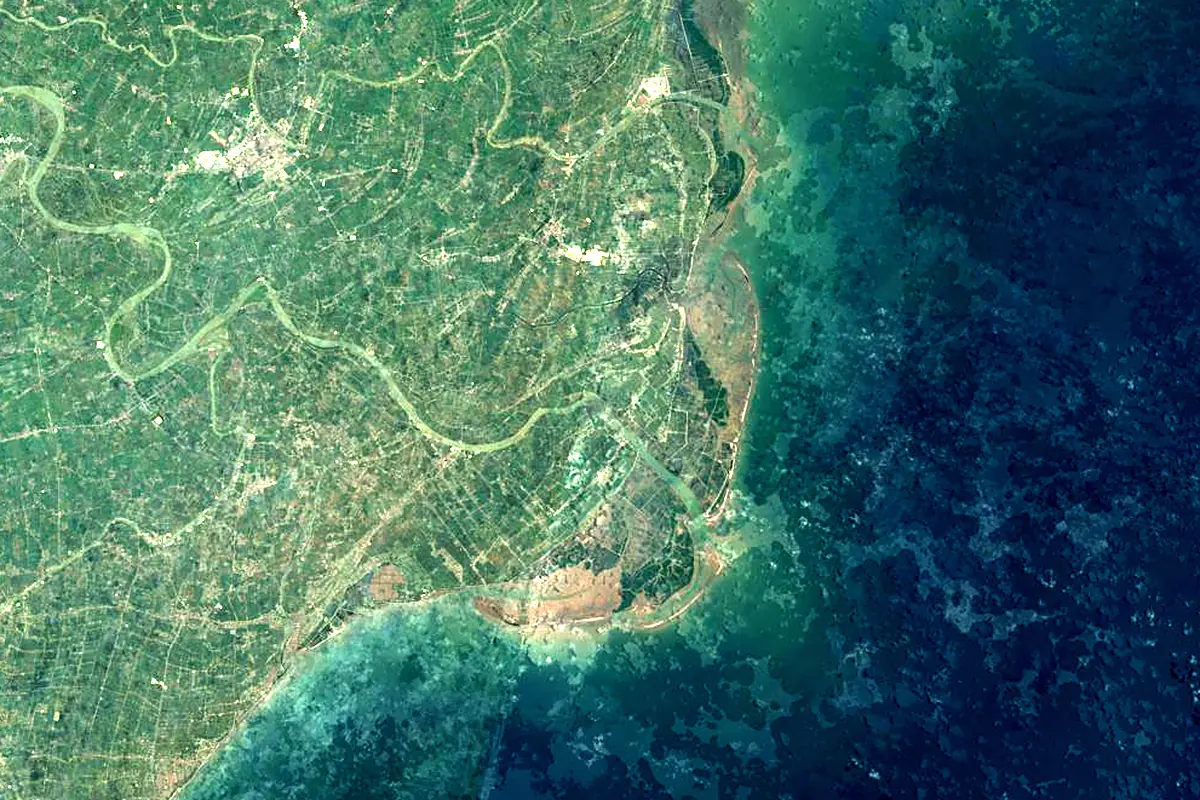
Sentinel-2 cloudless 2016 by EOX IT Services GmbH (contains modified Copernicus Sentinel data 2016), CC BY 4.0. The glowing line is the river as drawn by RiverATLAS.
Tributaries
Where it flows, and what flows into it
Tributaries (3)
Also: Nanxi River
 Laos
LaosWhere these numbers come from
| Name, length, places | Wikidata (Q206850) · CC0 |
|---|---|
| Course, profile, basin | RiverATLAS v1.0 (HydroATLAS, Linke et al. 2019) · CC BY 4.0 — followed along the river network from the point given by Wikidata |
| Flow | WaterGAP (RiverATLAS), 1971–2000 · CC BY 4.0 |
| Climate along the river | WorldClim (RiverATLAS), 1970–2000 · CC BY 4.0 |
| Towns, bridges, dams | Wikidata · CC0; GeoNames · CC BY 4.0 |
| Along the river | © OpenStreetMap contributors · ODbL |
| Images | EOX Sentinel-2 cloudless 2016 · CC BY 4.0; Wikimedia Commons |
| Our other atlases | Lakeyas — Wikidata · CC0; © OpenStreetMap contributors · ODbL; GeoNames · CC BY 4.0; HydroLAKES · CC BY 4.0; NOAA OISST |
Every source and licence is on the data sources page.
The family
Do you prefer beaches, lakes, mountains, waterfalls, islands, rivers or canyons?
Same idea, other landscapes: field atlases built on open data, month by month, in seven languages.
 beaches
 Find your beach: sea temperature, sun and swimming month by month.Visit lakes
 Every lake on Earth: water temperature, ice, depth and the shore.Coming soonVisit
  mountains
 Every summit in 3D: summit weather, the 0 °C line, huts and trails.Visit
  waterfalls
 Every waterfall: height, flow month by month and when it roars.Coming soonVisit
  islands
 Every island from the sea up: size, sea temperature, ferries and 3D.Coming soonVisit
  rivers
 Every river from source to sea: the journey, the flow and the basin in numbers.You are here
 canyons
 Every canyon cut to scale: depth to the floor, rim and floor temperatures, trails and viewpoints.Coming soonVisit