River
Tama River
138 km from source to mouth · Japan.
 JapanFlows into Tokyo Bay
In numbers
Length
138km
Average flow
37m³/s
Basin
1,240km²
Drop
593m
from 593 m to 0 m
Country
1
The journey
From source to mouth
138 km of river and 58 stops on the way: 22 towns and cities on its banks, dams, bridges and the tributaries that feed it.
- 0 kmMount Kasatoriat 593 m
- 26 kmLake Okutama3.9 km²
- 27 kmDōdokoro Bridge
- 34 kmHikawa4,750 people
- 42 kmOkutama bridge
- 56 kmŌme133,535 people
- 63 kmTomoda-Suikan-bashi
- 64 kmOzaku Weir
- 67 kmHamura Weir
- 67 kmHamura54,622 people
- 67 kmHamurasekishita Bridge
- 70 kmNagata Bridge
- 71 kmFussa56,786 people
- 71 kmTama Bridge
- 72 kmTamagawa Bridge (Itsukaichi Line)
- 73 kmMutsumi Bridge
- 74 kmAkigawa Rivertributary
- 76 kmpipeline bridge in Hachiōji – Akishima
- 77 kmHachiōji-shi575,721 people
- 80 kmTama River railway bridge
- 85 kmHino190,435 people
- 87 kmHino Bridge
- 89 kmKunitachi77,130 people
- 94 kmSekido Bridge
- 95 kmTama148,285 people
- 97 kmTamagawa Bridge (Musashino Line)
- 97 kmTamagawa Bridge (Nambu Line)
- 101 kmInagi Bridge
- 103 kmpipeline bridge in Inagi – Chōfu
- 103 kmTamagawara Bridge
- 104 kmAsao-ku180,763 people
- 104 kmTamagawa Bridge (Keiō Sagamihara Line)
- 105 kmSuga-inadazutsumi5,842 people
- 109 kmKomae84,772 people
- 109 kmNoborito25,662 people
- 109 kmTamasuidō-bashi
- 110 kmTamagawa Bridge
- 113 kmTomei Expressway Tamagawa Bridge
- 116 kmTamagawa12,170 people
- 117 kmShin Futago Bridge
- 117 kmFutago Bridge
- 117 kmYōga15,817 people
- 122 kmJiyūgaoka7,503 people
- 123 kmDen’enchōfu18,952 people
- 124 kmMaruko Bridge
- 124 kmNakahara-ku263,760 people
- 127 kmGas-bashi
- 128 kmIkegami30,959 people
- 130 kmNogawa Rivertributary
- 130 kmOta737,187 people
- 130 kmŌta748,081 people
- 132 kmRokugōgawa Bridge (Keikyu)
- 133 kmRokugo Bridge
- 133 kmKawasaki1,539,522 people
- 136 kmDaishi Bridge
- 136 kmKosoku daishi bridge
- 138 kmTamagawa Tunnel
- 138 kmHaneda14,604 people
- 138 kmTamagawa Sky Bridge
- 138 kmTokyo Bayat 0 m
Water level along the river (RiverATLAS; the height is exaggerated). Towns: GeoNames and Wikidata; bridges, dams and tributaries: Wikidata.
River in Japan
At the mouth it carries 37 m³/s on average: an Olympic pool every 68 seconds. It drops from 593 m to 0 m, 4.3 m per kilometre on average. Its basin covers 1,240 km², about the size of MQ. 4.3 million people live in it. Highest water: June and from September to October; lowest: January. Dams and reservoirs hold back a large share of its water (19% of a year's flow).
Where to start
- KawasakiLargest city on its banks · 1,539,522 people
- Tokyo Haneda International Airport (HND)Nearest airport with scheduled flights, 8 km from the cityCar hire at HND airport (Tokyo)Discover Cars · Affiliate link↗
- On the water3 ferry piers, marinas, boat rentals and boat ramps along the river (OpenStreetMap)
- From April to May, July and from October to NovemberThe best months to visit
Tama River, month by month
Highest water: June and from September to October
Lowest water: January. Best months to visit: from April to May, July and from October to November.
From about 16 m³/s in the lowest month to 55 m³/s in the highest. An estimate: the monthly flow is modelled from the lowest and highest months of WaterGAP (RiverATLAS, 1971–2000) and the rain and snow along the river (WorldClim). Dams change the real rhythm. The chip is the average air temperature; below it, the month's rain.
Plan the trip
Plan the trip: boat trips, a bed by the river, a car
Some links above are affiliate links: if you book through them we may earn a commission, at no extra cost to you. It never changes what the data on this page says.
The basin
Tama River: the basin in numbers
1,253 km² of land send their water to this river. This is what lives on it.
- 4.3millionpeople live in the basin
- 3,469/km²people per km²
- 523maverage altitude of the basin
- 1,547mmof rain a year (basin average)
- 12.1°Caverage air temperature
- 57%protected areas
- 0.3%covered by lakes
- 0.2km³held in reservoirs
What covers the basin
- 57% Forest
- 5% Cropland
- 46% Towns and cities
RiverATLAS (HydroATLAS v1.0, CC BY 4.0): land cover, people, protected areas, glaciers and dams over the whole basin upstream of the mouth.
Along the river
Tama River: what you find on the way
- 125Weirs
- 3Locks
- 8WaterfallsSuijin no Taki (Waterfall of the Water God) and 7 more
- 1Boat ramps
- 1Ferry piers
- 1River beaches
From OpenStreetMap, within 1.3 km of the river. Not mapped is not the same as not there.
Cross-checked with our atlases
Tama River in our other atlases
What our sister atlases know about the waterfalls on this river, the lakes it flows through, the beaches at its mouth, the mountains where it rises and the islands off its mouth.
 1lake on its wayLakeyas
 27mountains at the sourcePeakyas
 17islands off the mouthIslandyas
Lakes and reservoirs (1)
Lakes it flows through, by Lakeyas
- Lake Okutamakm 20 · 15 m deep3.9km²
Lakeyas is coming soonOpen Lakeyas ↗
Mountains at the source (27)
Within 15 km of the source, by Peakyas
- Mount Kobushi10 km away2,475m
- Mount Kokushi14 km away2,592m
- Mount Kitaokusenjō14 km away2,601m
- Mount Kumotori11 km away2,017m
- Mount Sanpō11 km away2,483m
- Mount Tokusa9.9 km away2,469m
- Mount Okusenjō14 km away2,409m
- Mount Daibosatsu12 km away2,057m
19 more on PeakyasOpen Peakyas ↗
Islands off the mouth (17)
Within 30 km of the mouth, by Islandyas
- Odaiba10 km away6.3km²
- Sarushima28 km away0.1km²
- Yumenoshima14 km away1.5km²
- Toyosu12 km away
- Shibaura Island11 km away
- Hakkeijima24 km away0.2km²
- Tennōzu Isle9.2 km away
- Azuma Island28 km away0.8km²
9 more on IslandyasIslandyas is coming soonOpen Islandyas ↗
From space
The source and the mouth, seen from orbit
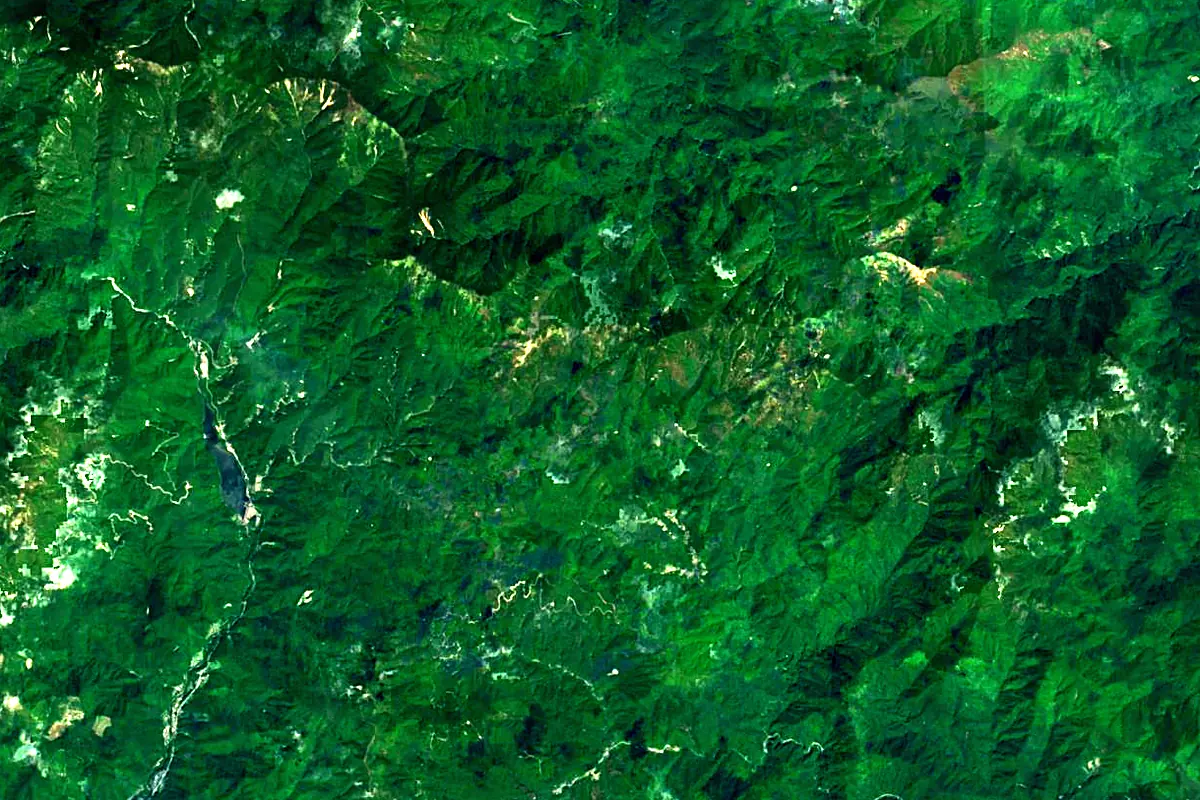
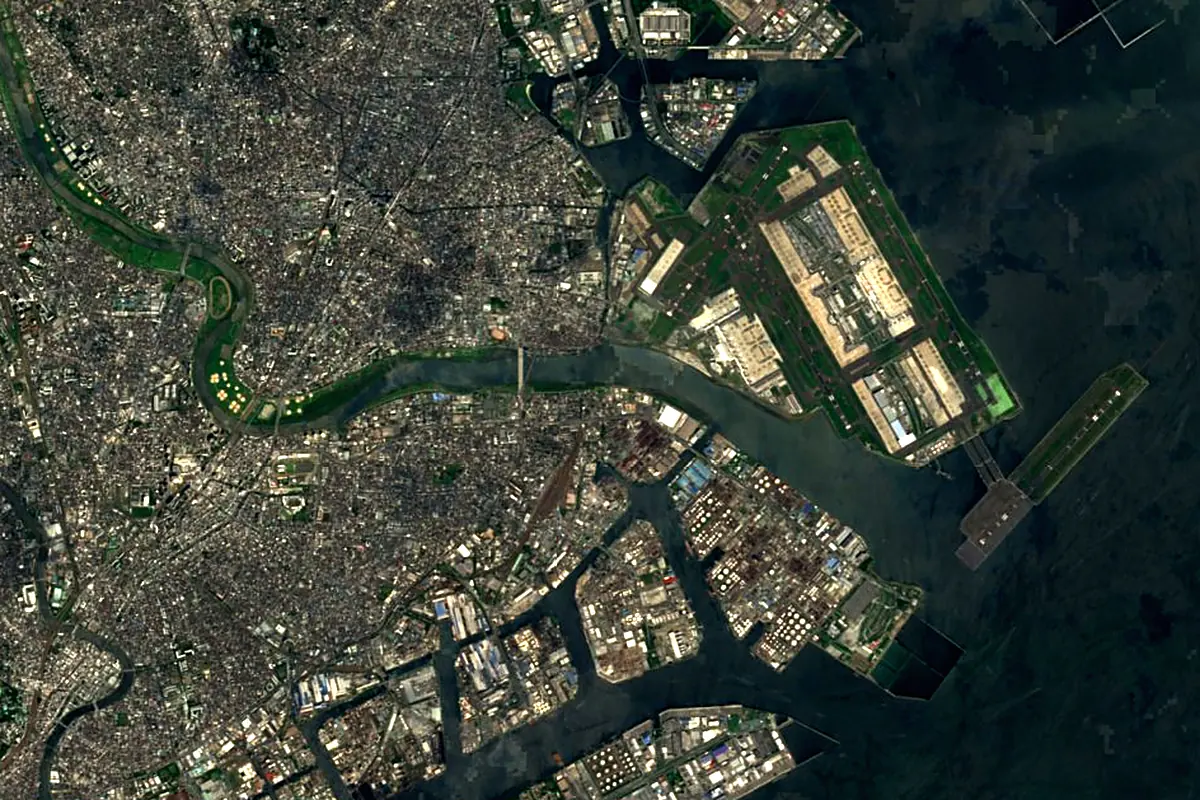
Sentinel-2 cloudless 2016 by EOX IT Services GmbH (contains modified Copernicus Sentinel data 2016), CC BY 4.0. The glowing line is the river as drawn by RiverATLAS.
Photos
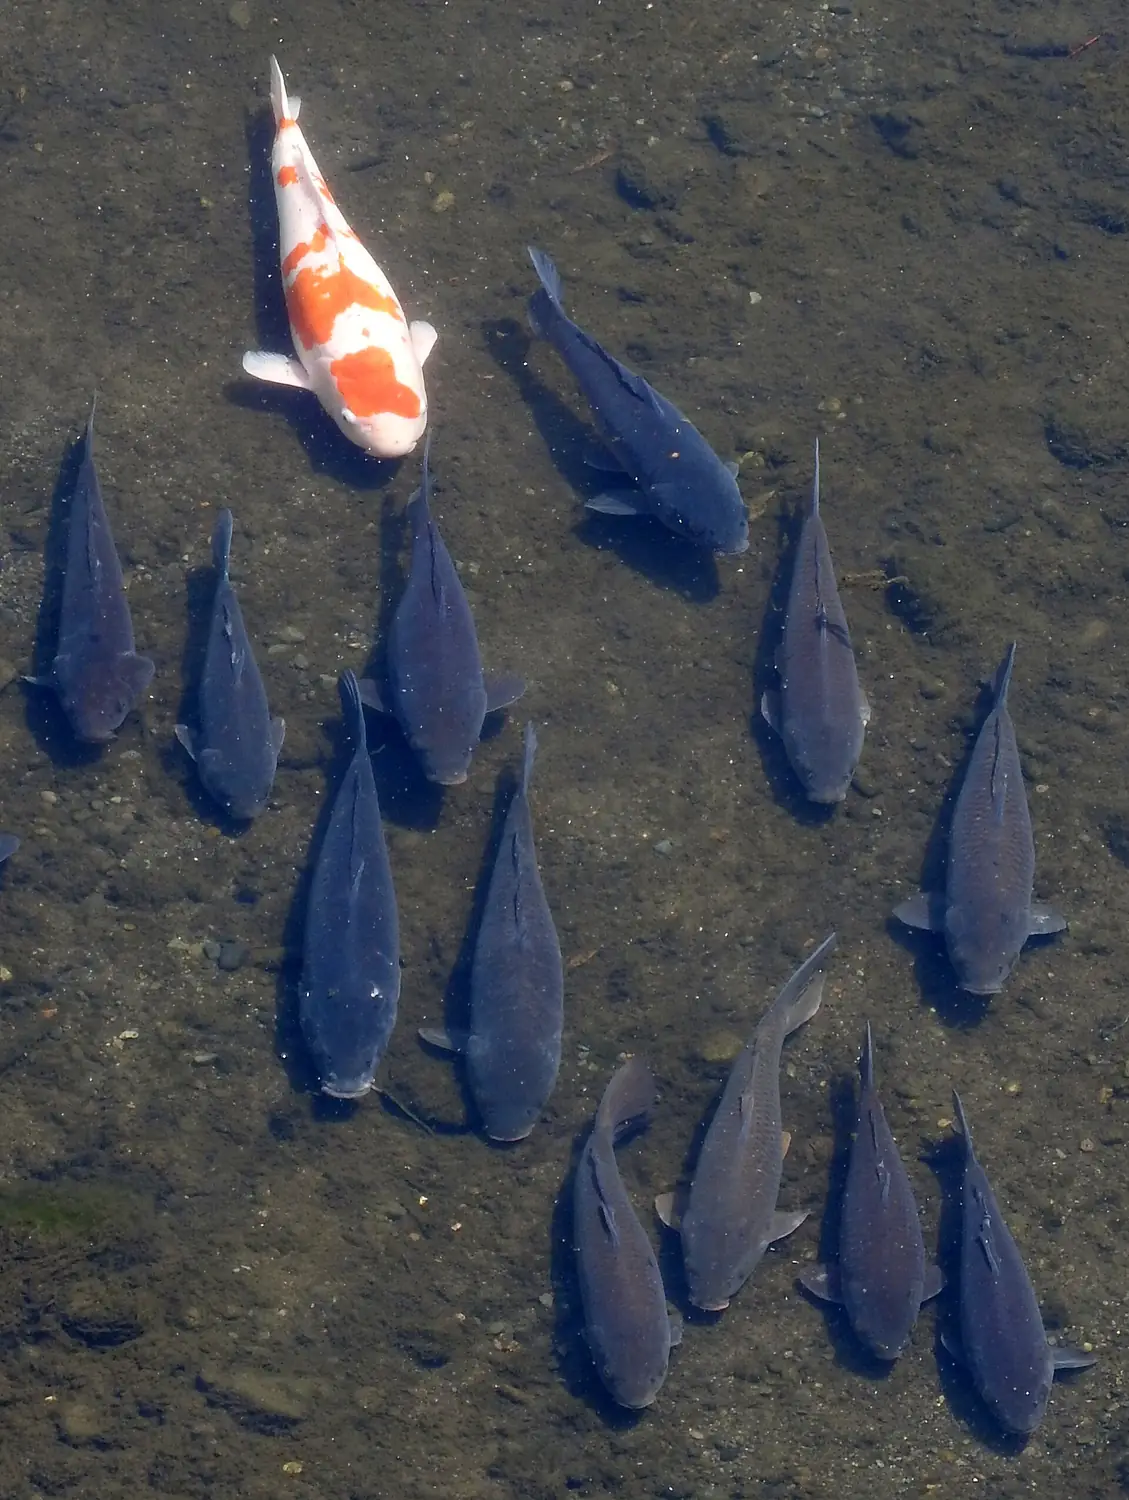
Tama River in pictures
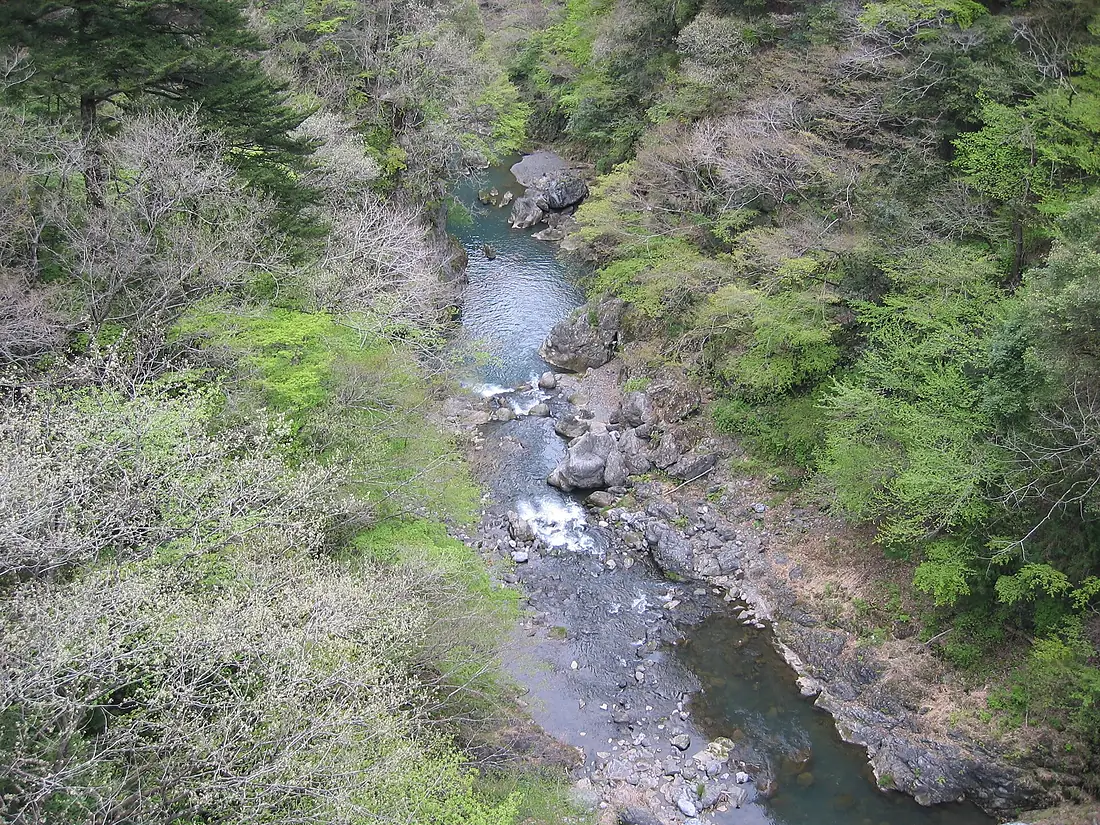
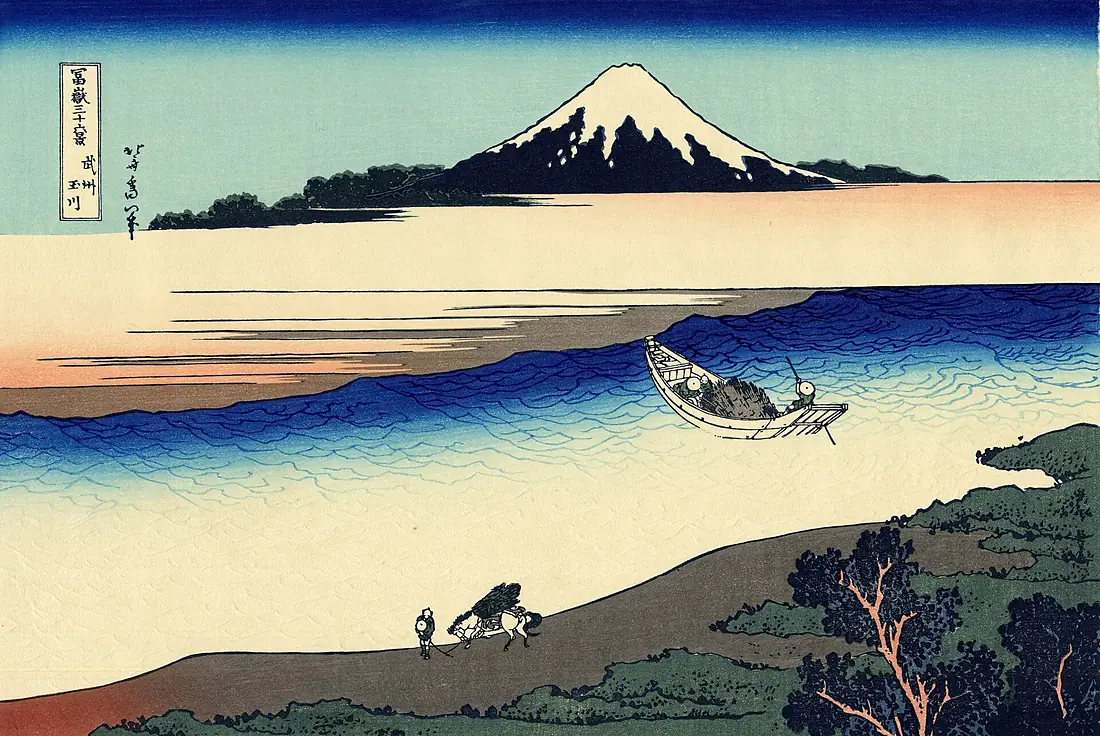
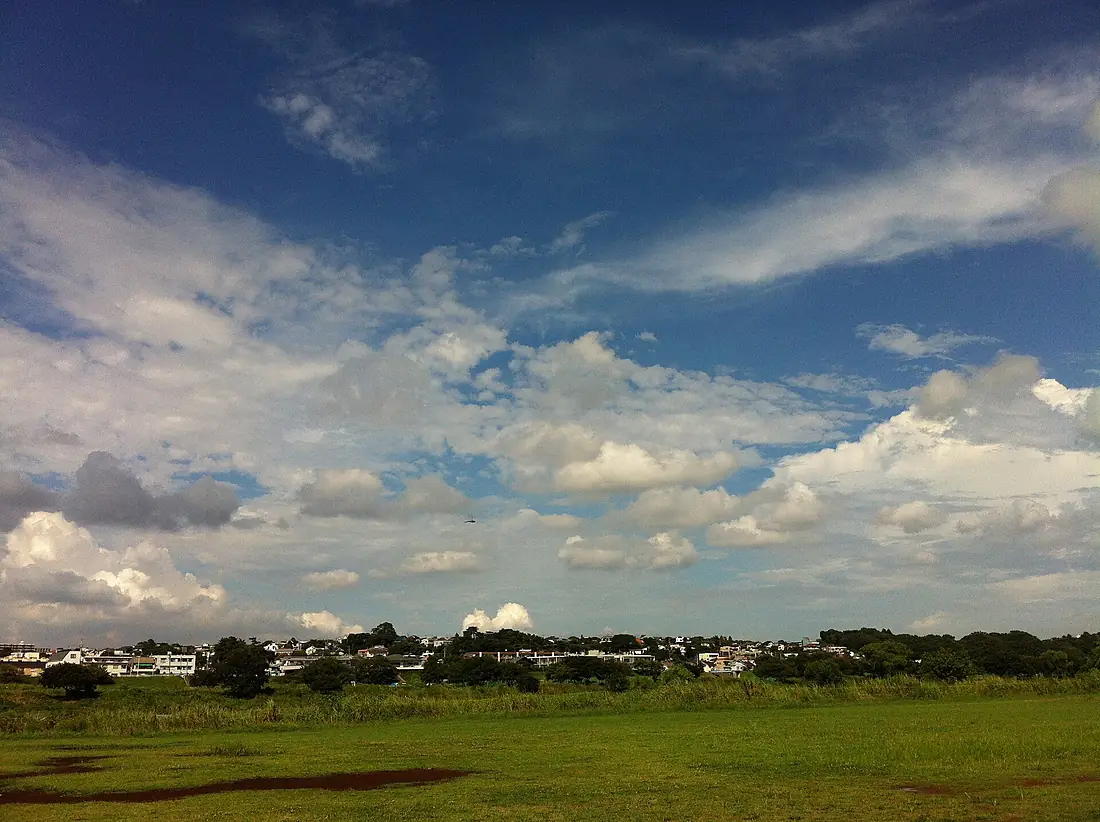
Tributaries
Where it flows, and what flows into it
Tributaries (14)
Also: Akigawa River, Asa River, Nogawa River, Misawa River, Yazawa River, Hirase River, Maruko River, Ōkuri River, Hirai River, Nippara River, Zanbori River, Hodokubo River, Ōtaba River, Yaji River
Nearby
Rivers nearby
Japan173 km30 m³/s21 km awayTone RiverJapan322 km260 m³/s98 km awayFuji RiverJapan128 km63 m³/s112 km awayShinano RiverJapan367 km460 m³/s272 km awayAgano RiverJapan210 km450 m³/s272 km awayNagara RiverJapan166 km120 m³/s280 km awayAbukuma RiverJapan239 km67 m³/s298 km awayLake BiwaJapan63 km57 m³/s335 km awayWhere these numbers come from
| Name, length, places | Wikidata (Q1063006) · CC0 |
|---|---|
| Course, profile, basin | RiverATLAS v1.0 (HydroATLAS, Linke et al. 2019) · CC BY 4.0 — followed from the source to the mouth given by Wikidata |
| Flow | WaterGAP (RiverATLAS), 1971–2000 · CC BY 4.0 |
| Climate along the river | WorldClim (RiverATLAS), 1970–2000 · CC BY 4.0 |
| Towns, bridges, dams | Wikidata · CC0; GeoNames · CC BY 4.0 |
| Along the river | © OpenStreetMap contributors · ODbL |
| Images | EOX Sentinel-2 cloudless 2016 · CC BY 4.0; Wikimedia Commons |
| Our other atlases | Lakeyas, Peakyas, Islandyas — Wikidata · CC0; © OpenStreetMap contributors · ODbL; GeoNames · CC BY 4.0; HydroLAKES · CC BY 4.0; NOAA OISST |
Every source and licence is on the data sources page.
The family
Do you prefer beaches, lakes, mountains, waterfalls, islands, rivers or canyons?
Same idea, other landscapes: field atlases built on open data, month by month, in seven languages.
 beaches
 Find your beach: sea temperature, sun and swimming month by month.Visit lakes
 Every lake on Earth: water temperature, ice, depth and the shore.Coming soonVisit mountains
 Every summit in 3D: summit weather, the 0 °C line, huts and trails.Visit
  waterfalls
 Every waterfall: height, flow month by month and when it roars.Coming soonVisit islands
 Every island from the sea up: size, sea temperature, ferries and 3D.Coming soonVisit
  rivers
 Every river from source to sea: the journey, the flow and the basin in numbers.You are here
 canyons
 Every canyon cut to scale: depth to the floor, rim and floor temperatures, trails and viewpoints.Coming soonVisit