Stream
Mugere River
293 km from source to mouth · Burundi.
 Burundi1st longest in Burundi
In numbers
Length
293km
Average flow
100m³/s
Basin
14,740km²
Drop
886m
from 1,653 m to 767 m
Country
1
The journey
From source to mouth
293 km of river and 5 stops on the way: 4 towns and cities on its banks, dams, bridges and the tributaries that feed it.
- 0 kmSourceat 1,653 m
- 8 kmSake17,151 people
- 136 kmCyangugu43,866 people
- 137 kmLake Kivu2,401 km²
- 175 kmBugarama31,086 people
- 272 kmGatumba18,104 people
- 293 kmMouthat 767 m
Water level along the river (RiverATLAS; the height is exaggerated). Towns: GeoNames and Wikidata; bridges, dams and tributaries: Wikidata.
Watercourse in Burundi
At the mouth it carries 101 m³/s on average: an Olympic pool every 25 seconds. It drops from 1,653 m to 767 m, 3.0 m per kilometre on average. Its basin covers 14,740 km², about the size of TL. 5.7 million people live in it. Highest water: from April to May; lowest: from July to September. No large dam holds it back: it is one of the world's free-flowing rivers.
Where to start
- CyanguguLargest city on its banks · 43,866 people
- Kamembe Airport (KME)Nearest airport with scheduled flights, 2 km from the city
- On the water5 ferry piers, marinas, boat rentals and boat ramps along the river (OpenStreetMap)
- From June to AugustThe best months to visit
Mugere River, month by month
Highest water: from April to May
Lowest water: from July to September. Best months to visit: from June to August.
From about 19 m³/s in the lowest month to 190 m³/s in the highest. An estimate: the monthly flow is modelled from the lowest and highest months of WaterGAP (RiverATLAS, 1971–2000) and the rain and snow along the river (WorldClim). Dams change the real rhythm. The chip is the average air temperature; below it, the month's rain.
Plan the trip
Plan the trip: boat trips, a bed by the river, a car
Some links above are affiliate links: if you book through them we may earn a commission, at no extra cost to you. It never changes what the data on this page says.
The basin
Mugere River: the basin in numbers
14,740 km² of land send their water to this river. This is what lives on it.
- 5.7millionpeople live in the basin
- 414/km²people per km²
- 1,646maverage altitude of the basin
- 1,401mmof rain a year (basin average)
- 19.2°Caverage air temperature
- 12%protected areas
- 18.1%covered by lakes
- 0.0km³held in reservoirs
What covers the basin
- 40% Forest
- 19% Cropland
- 11% Pasture
- 18% Towns and cities
RiverATLAS (HydroATLAS v1.0, CC BY 4.0): land cover, people, protected areas, glaciers and dams over the whole basin upstream of the mouth.
Along the river
Mugere River: what you find on the way
- 1Weirs
- 5Ferry piers
From OpenStreetMap, within 1.9 km of the river. Not mapped is not the same as not there.
Cross-checked with our atlases
Mugere River in our other atlases
What our sister atlases know about the waterfalls on this river, the lakes it flows through, the beaches at its mouth, the mountains where it rises and the islands off its mouth.
 1lake on its wayLakeyas
 1mountain at the sourcePeakyas
Lakes and reservoirs (1)
Lakes it flows through, by Lakeyas
- Lake Kivukm 137 · 485 m deep2,401km²
Lakeyas is coming soonOpen Lakeyas ↗
Mountains at the source (1)
Within 15 km of the source, by Peakyas
- Rumoka volcano10 km away1,711m
From space
The source and the mouth, seen from orbit
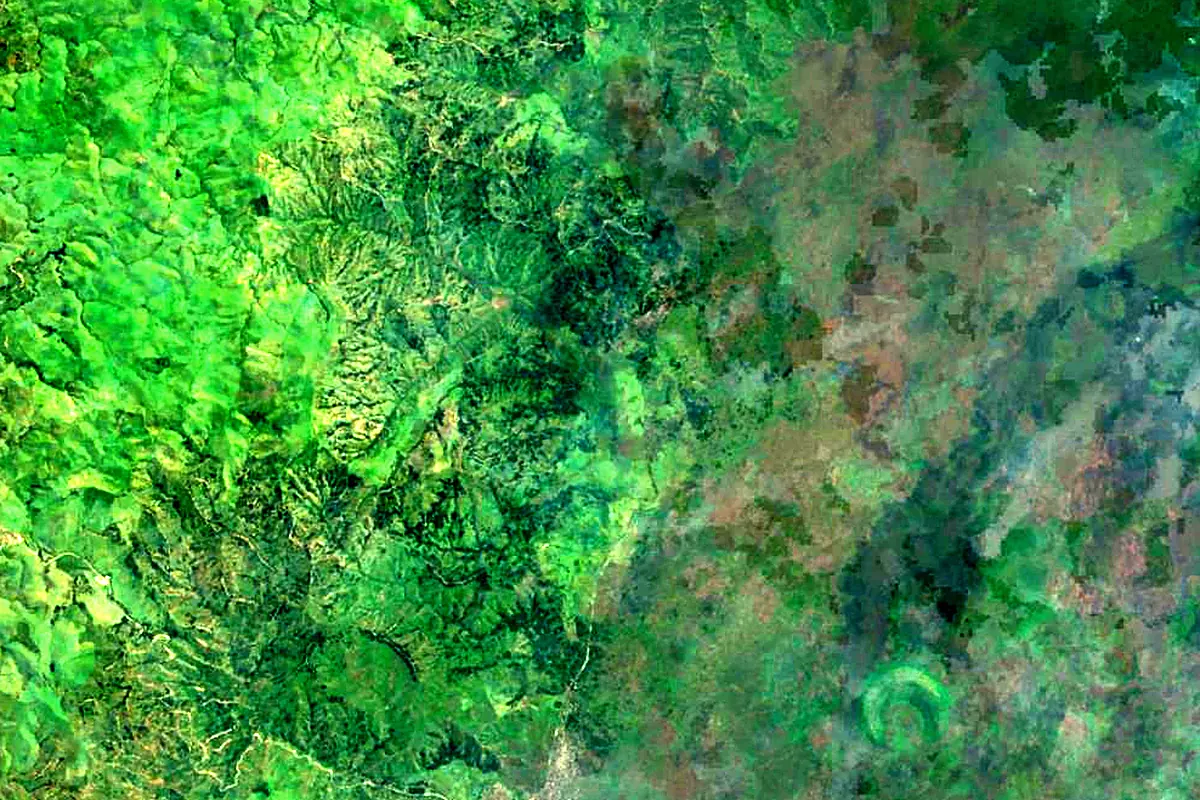
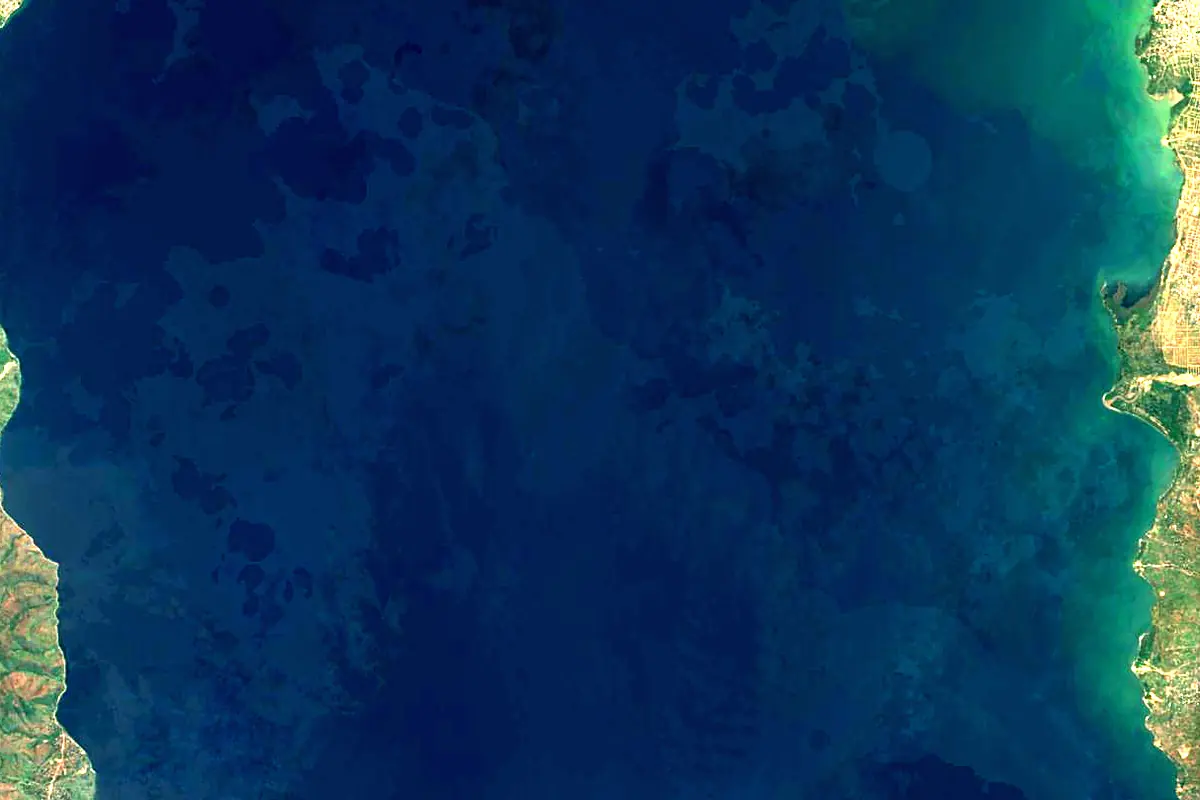
Sentinel-2 cloudless 2016 by EOX IT Services GmbH (contains modified Copernicus Sentinel data 2016), CC BY 4.0. The glowing line is the river as drawn by RiverATLAS.
Photos
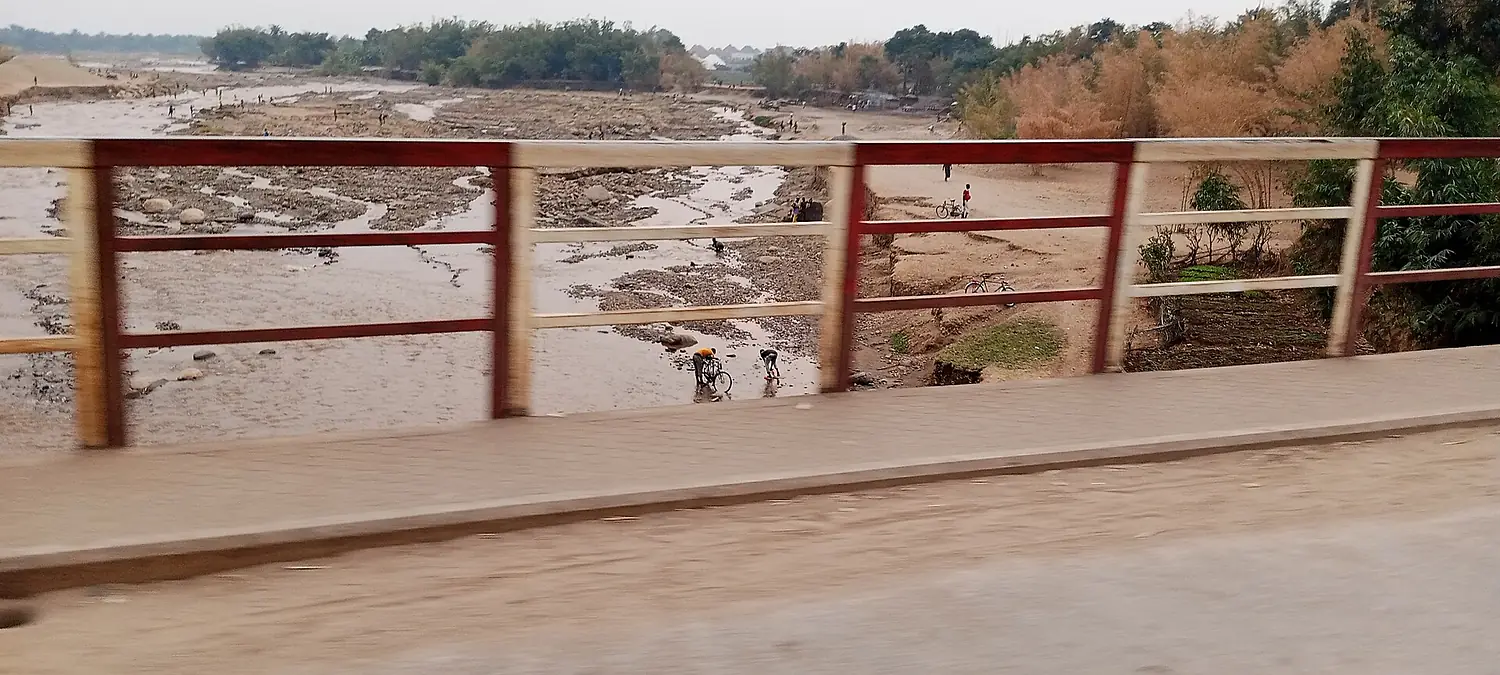
Mugere River in pictures
Tributaries
Where it flows, and what flows into it
In the same basin
 Angola4,700 km41,800 m³/sKasai River
 Republic of the Congo2,272 km12,000 m³/sUbangi River
 Central African Republic1,060 km5,900 m³/sKwango River
 DR Congo1,770 km2,700 m³/sUeleDR Congo1,210 km1,500 m³/sLomami RiverDR Congo1,280 km3,000 m³/sSanghaRepublic of the Congo785 km2,500 m³/sEbola RiverDR Congo250 km320 m³/sMbomou RiverCentral African Republic800 km1,300 m³/sLuvua RiverDR Congo350 km600 m³/s
Nearby
Rivers nearby
Burundi117 km400 m³/s11 km awayRuhwa River Rwanda50 km6.0 m³/s86 km awayMubarazi RiverBurundi67 km28 m³/s86 km awayNyabarongo RiverRwanda300 km110 m³/s179 km awayMalagarasi River
 Tanzania475 km340 m³/s208 km awayRurubu RiverTanzania300 km100 m³/s209 km awayAkanyaru RiverRwanda212 km110 m³/s184 km awayLukuga RiverDR Congo320 km1,800 m³/s353 km away
Where these numbers come from
| Name, length, places | Wikidata (Q21331021) · CC0 |
|---|---|
| Course, profile, basin | RiverATLAS v1.0 (HydroATLAS, Linke et al. 2019) · CC BY 4.0 — followed along the river network from the point given by Wikidata |
| Flow | WaterGAP (RiverATLAS), 1971–2000 · CC BY 4.0 |
| Climate along the river | WorldClim (RiverATLAS), 1970–2000 · CC BY 4.0 |
| Towns, bridges, dams | Wikidata · CC0; GeoNames · CC BY 4.0 |
| Along the river | © OpenStreetMap contributors · ODbL |
| Images | EOX Sentinel-2 cloudless 2016 · CC BY 4.0; Wikimedia Commons |
| Our other atlases | Lakeyas, Peakyas — Wikidata · CC0; © OpenStreetMap contributors · ODbL; GeoNames · CC BY 4.0; HydroLAKES · CC BY 4.0; NOAA OISST |
Every source and licence is on the data sources page.
The family
Do you prefer beaches, lakes, mountains, waterfalls, islands, rivers or canyons?
Same idea, other landscapes: field atlases built on open data, month by month, in seven languages.
 beaches
 Find your beach: sea temperature, sun and swimming month by month.Visit lakes
 Every lake on Earth: water temperature, ice, depth and the shore.Coming soonVisit mountains
 Every summit in 3D: summit weather, the 0 °C line, huts and trails.Visit
  waterfalls
 Every waterfall: height, flow month by month and when it roars.Coming soonVisit
  islands
 Every island from the sea up: size, sea temperature, ferries and 3D.Coming soonVisit
  rivers
 Every river from source to sea: the journey, the flow and the basin in numbers.You are here
 canyons
 Every canyon cut to scale: depth to the floor, rim and floor temperatures, trails and viewpoints.Coming soonVisit