River
Red River
2,189 km from source to mouth · United States.
 United StatesFlows into Atchafalaya River5th longest in United States
In numbers
Length
2,189km
Average flow
1,900m³/s
Basin
233,000km²
Drop
1,370m
from 1,376 m to 6 m
Country
1
The journey
From source to mouth
2,189 km of river and 45 stops on the way: 10 towns and cities on its banks, dams, bridges and the tributaries that feed it.
- 0 kmBuck Creekat 1,376 m
- 106 kmHereford15,021 people
- 164 kmCanyon14,887 people
- 421 kmPrairie Dog Town Fork Red Rivertributary
- 503 kmSalt Fork Red Rivertributary
- 529 kmNorth Fork Red Rivertributary
- 564 kmPease Rivertributary
- 617 kmBurkburnett11,043 people
- 646 kmCache Creektributary
- 669 kmWichita Rivertributary
- 676 kmState Highway 79 Bridge at the Red River
- 833 kmLove County10,146 people
- 857 kmHubert H. Moss Lake3.8 km²
- 868 kmLeeper Lake0.5 km²
- 977 kmRandell Lake0.6 km²
- 978 kmLake Texoma263 km²
- 1,034 kmState Highway No. 78 Bridge at the Red River
- 1,083 kmBlue Rivertributary
- 1,129 kmRoebuck Lake0.4 km²
- 1,182 kmKiamichi Rivertributary
- 1,251 kmForty-one Cut-off Lake0.9 km²
- 1,377 kmRoseborough Lake0.5 km²
- 1,435 kmLittle Rivertributary
- 1,481 kmGarland195 people
- 1,481 kmRed River Bridge
- 1,500 kmCandler Lake0.9 km²
- 1,542 kmSulphur Rivertributary
- 1,561 kmOld River0.5 km²
- 1,573 kmRed River LA 2 Bridge
- 1,630 kmShreveport187,593 people
- 1,631 kmLong-Allen Bridge (Shreveport)
- 1,631 kmKCS Shreveport Bridge
- 1,632 kmBossier City68,094 people
- 1,658 kmOld River Lake0.8 km²
- 1,696 kmCrichton Lake0.3 km²
- 1,699 kmWilson Lake0.4 km²
- 1,758 kmRound Lake0.6 km²
- 1,779 kmSaline Bayoutributary
- 1,787 kmDunn Lake0.5 km²
- 1,803 kmChico Lake0.4 km²
- 1,821 kmCane Rivertributary
- 1,838 kmMill Pond0.7 km²
- 1,839 kmBoyce888 people
- 1,869 kmPineville14,403 people
- 1,869 kmAlexandria45,275 people
- 2,000 kmGrand Bay0.5 km²
- 2,189 kmAtchafalaya Riverat 6 m
Water level along the river (RiverATLAS; the height is exaggerated). Towns: GeoNames and Wikidata; bridges, dams and tributaries: Wikidata.
Major river in the southern United States
At the mouth it carries 1,900 m³/s on average: an Olympic pool every 1.3 seconds. It drops from 1,376 m to 6 m, 0.6 m per kilometre on average. Its basin covers 233,000 km², about the size of UG. 3.2 million people live in it. Highest water: March, from May to June and December. It is heavily dammed: reservoirs can hold 63% of a year's flow.
Where to start
- ShreveportLargest city on its banks · 187,593 people
- Shreveport Regional Airport (SHV)Nearest airport with scheduled flights, 12 km from the cityCar hire at SHV airport (Shreveport)Discover Cars · Affiliate link↗
- On the water54 ferry piers, marinas, boat rentals and boat ramps along the river (OpenStreetMap)
- From April to June and from September to OctoberThe best months to visit
Red River, month by month
Highest water: March, from May to June and December
Best months to visit: from April to June and from September to October.
From about 660 m³/s in the lowest month to 3,700 m³/s in the highest. An estimate: the monthly flow is modelled from the lowest and highest months of WaterGAP (RiverATLAS, 1971–2000) and the rain and snow along the river (WorldClim). Dams change the real rhythm. The chip is the average air temperature; below it, the month's rain.
Plan the trip
Plan the trip: boat trips, a bed by the river, a car
Some links above are affiliate links: if you book through them we may earn a commission, at no extra cost to you. It never changes what the data on this page says.
The basin
Red River: the basin in numbers
239,161 km² of land send their water to this river. This is what lives on it.
- 3.2millionpeople live in the basin
- 14/km²people per km²
- 319maverage altitude of the basin
- 1,022mmof rain a year (basin average)
- 16.6°Caverage air temperature
- 3%protected areas
- 1.0%covered by lakes
- 44km³held in reservoirs
What covers the basin
- 40% Forest
- 27% Cropland
- 27% Pasture
- 1% Towns and cities
RiverATLAS (HydroATLAS v1.0, CC BY 4.0): land cover, people, protected areas, glaciers and dams over the whole basin upstream of the mouth.
Along the river
Red River: what you find on the way
- 2Weirs
- 17LocksJoe D. Waggonner, Jr. Lock and Dam, Red River, Russell B. Long Lock and Dam and 14 more
- 1WaterfallsRiver Falls
- 47Boat rampsIndex Bridge Boat Ramp and 46 more
- 7MarinasCedar Bayou Marina at Lake Texoma, Cedar Mills Marina and Resort, Mill Creek Resort and Marina and 4 more
From OpenStreetMap, within 2.6 km of the river. Not mapped is not the same as not there.
Cross-checked with our atlases
Red River in our other atlases
What our sister atlases know about the waterfalls on this river, the lakes it flows through, the beaches at its mouth, the mountains where it rises and the islands off its mouth.
 17lakes on its wayLakeyas
Lakes and reservoirs (17)
Lakes it flows through, by Lakeyas
- Hubert H. Moss Lakekm 7683.8km²
- Leeper Lakekm 7780.5km²
- Lake Texomakm 877263km²
- Forty-one Cut-off Lakekm 1,1220.9km²
- Candler Lakekm 1,3450.9km²
- Old River Lakekm 1,4870.8km²
- Chico Lakekm 1,6170.4km²
- Mill Pondkm 1,6480.7km²
9 more on LakeyasLakeyas is coming soonOpen Lakeyas ↗
From space
The source and the mouth, seen from orbit
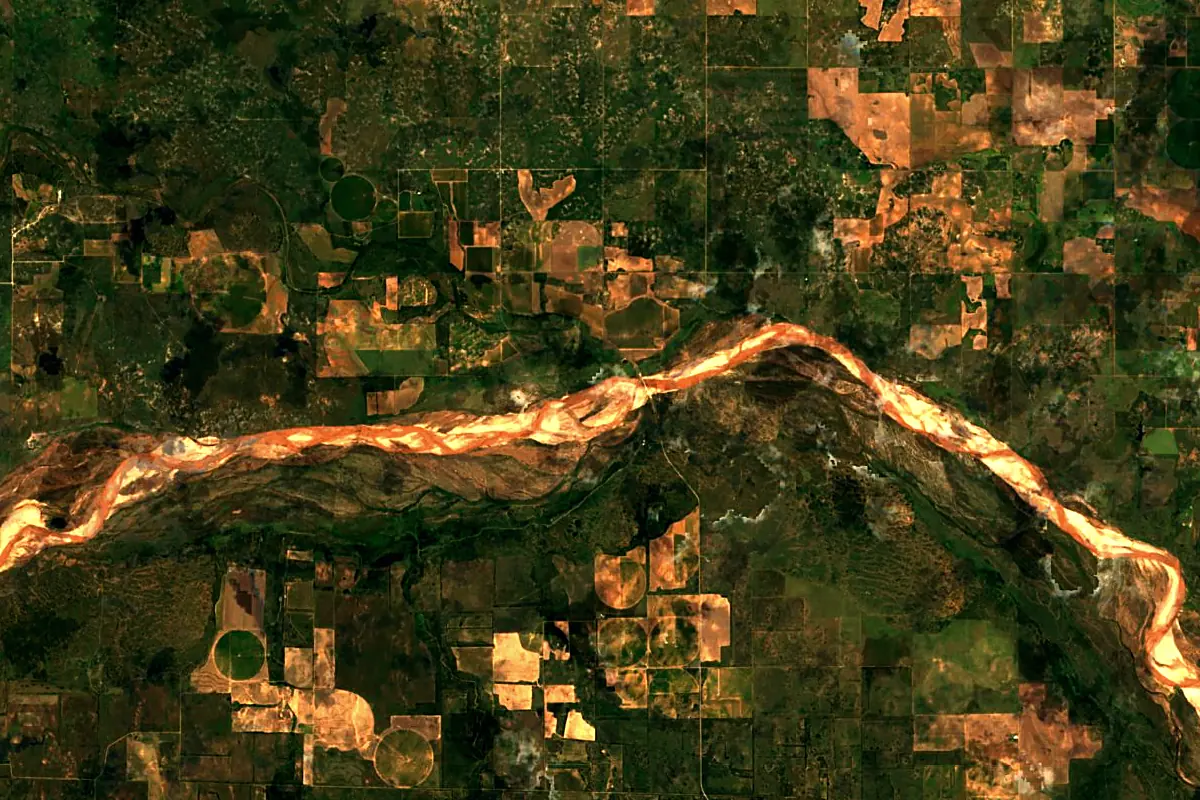
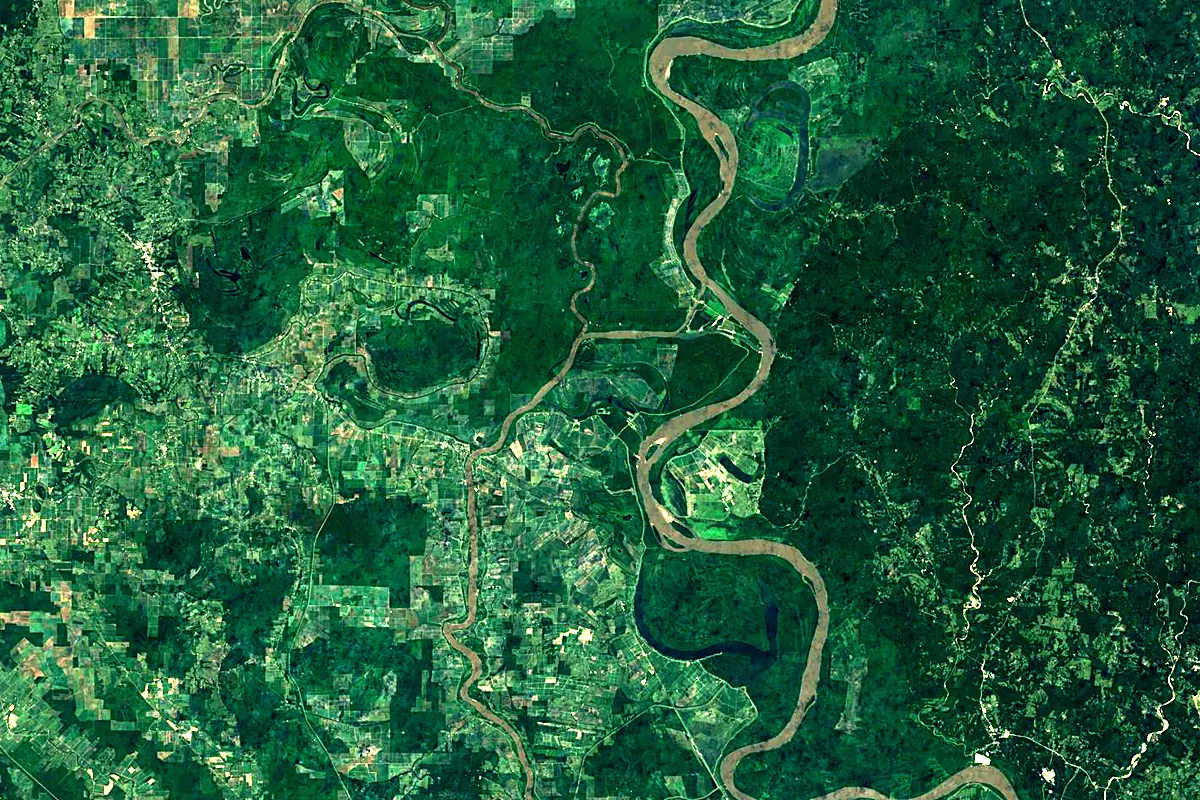
Sentinel-2 cloudless 2016 by EOX IT Services GmbH (contains modified Copernicus Sentinel data 2016), CC BY 4.0. The glowing line is the river as drawn by RiverATLAS.
Tributaries
Where it flows, and what flows into it
It flows into
Atchafalaya RiverUnited States270 km240 m³/sTributaries (29)
Also: Washita River, Cane River, Sulphur River, Kiamichi River, Wichita River, Blue River, Cache Creek, Little River, Saline Bayou, Muddy Boggy Creek, North Fork Red River, Pease River, Prairie Dog Town Fork Red River, Salt Fork Red River, Big Mineral Creek, Big Pine Creek, Buck Creek, Cross Bayou, Glover River, Groesbeck Creek, Island Bayou, Pecan Bayou, Sanders Creek, Wanderers Creek
In the same basin
United States3,766 km12,700 m³/sMissouri RiverUnited States3,726 km2,500 m³/sOhio RiverUnited States1,579 km8,000 m³/sArkansas RiverUnited States2,364 km240 m³/sTennessee RiverUnited States1,049 km2,000 m³/sYellowstone RiverUnited States1,114 km390 m³/sPlatte RiverUnited States500 km200 m³/sCanadian RiverUnited States1,458 km200 m³/sIllinois RiverUnited States432 km660 m³/sAllegheny RiverUnited States523 km560 m³/sNearby
Rivers nearby
United States3,766 km12,700 m³/s316 km awaySabine RiverUnited States820 km270 m³/s231 km awayArkansas RiverUnited States2,364 km240 m³/s311 km awayWhite RiverUnited States1,162 km740 m³/s332 km awayTrinity RiverUnited States1,140 km210 m³/s320 km awayAlabama RiverUnited States640 km950 m³/s358 km awayMobile RiverUnited States72 km1,900 m³/s352 km awayBrazos RiverUnited States1,352 km240 m³/s427 km awayWhere these numbers come from
| Name, length, places | Wikidata (Q156032) · CC0 |
|---|---|
| Course, profile, basin | RiverATLAS v1.0 (HydroATLAS, Linke et al. 2019) · CC BY 4.0 — followed from the source to the mouth given by Wikidata |
| Flow | WaterGAP (RiverATLAS), 1971–2000 · CC BY 4.0 |
| Climate along the river | WorldClim (RiverATLAS), 1970–2000 · CC BY 4.0 |
| Towns, bridges, dams | Wikidata · CC0; GeoNames · CC BY 4.0 |
| Along the river | © OpenStreetMap contributors · ODbL |
| Images | EOX Sentinel-2 cloudless 2016 · CC BY 4.0; Wikimedia Commons |
| Our other atlases | Lakeyas — Wikidata · CC0; © OpenStreetMap contributors · ODbL; GeoNames · CC BY 4.0; HydroLAKES · CC BY 4.0; NOAA OISST |
Every source and licence is on the data sources page.
The family
Do you prefer beaches, lakes, mountains, waterfalls, islands, rivers or canyons?
Same idea, other landscapes: field atlases built on open data, month by month, in seven languages.
 beaches
 Find your beach: sea temperature, sun and swimming month by month.Visit lakes
 Every lake on Earth: water temperature, ice, depth and the shore.Coming soonVisit
  mountains
 Every summit in 3D: summit weather, the 0 °C line, huts and trails.Visit
  waterfalls
 Every waterfall: height, flow month by month and when it roars.Coming soonVisit
  islands
 Every island from the sea up: size, sea temperature, ferries and 3D.Coming soonVisit
  rivers
 Every river from source to sea: the journey, the flow and the basin in numbers.You are here
 canyons
 Every canyon cut to scale: depth to the floor, rim and floor temperatures, trails and viewpoints.Coming soonVisit