River
Monongahela River
209 km from source to mouth · United States.
 United StatesFlows into Ohio River
In numbers
Length
209km
Average flow
360m³/s
Basin
19,011km²
Drop
51m
from 267 m to 216 m
Country
1
The journey
From source to mouth
209 km of river and 68 stops on the way: 31 towns and cities on its banks, dams, bridges and the tributaries that feed it.
- 0 kmTygart Valley Riverat 267 m
- 0 kmTygart Valley Rivertributary
- 0 kmWest Fork Rivertributary
- 0 kmPleasant Valley3,196 people
- 0 kmFairmont Railroad Bridge
- 2 kmFairmont18,416 people
- 2 kmRobert H. Mollohan-Jefferson Street Bridge
- 44 kmMorgantown30,347 people
- 45 kmWestover4,223 people
- 62 kmPoint Marion1,156 people
- 62 kmAlbert Gallatin Memorial Bridge
- 62 kmCheat Rivertributary
- 76 kmMasontown3,399 people
- 79 kmMasontown Bridge
- 106 kmMaple Glen7,635 people
- 116 kmBrownsville Bridge
- 117 kmLane Bane Bridge
- 118 kmWest Brownsville Junction Bridge
- 123 kmCalifornia6,608 people
- 137 kmBelle Vernon Bridge
- 139 kmCharleroi4,015 people
- 140 kmCharleroi-Monessen Bridge
- 143 kmMonessen6,876 people
- 146 kmDonora4,569 people
- 154 kmMonongahela City Bridge
- 155 kmMonongahela4,159 people
- 158 kmNew Eagle2,049 people
- 170 kmRegis R. Malady Bridge
- 172 kmClairton6,681 people
- 173 kmUnion Railroad Clairton Bridge
- 176 kmWilson7,564 people
- 178 kmGlassport4,420 people
- 180 kmPort Vue3,744 people
- 180 kmW.D. Mansfield Memorial Bridge
- 182 kmYoughiogheny Rivertributary
- 182 kmWest Mifflin20,075 people
- 184 kmMcKeesport Connecting Railroad Bridge
- 184 kmMcKeesport17,727 people
- 184 kmMcKeesport-Duquesne Bridge
- 186 kmNorth Versailles10,571 people
- 187 kmDuquesne5,254 people
- 188 kmPRR Port Perry Bridge
- 188 kmUnion Railroad Port Perry Bridge
- 189 kmTurtle Creek5,272 people
- 189 kmNorth Braddock4,787 people
- 192 kmForest Hills6,443 people
- 192 kmRankin Bridge
- 192 kmRankin1,896 people
- 192 kmMunhall10,774 people
- 193 kmCarrie Furnace Hot Metal Bridge
- 193 kmSwissvale8,855 people
- 194 kmPinkerton's Landing Bridge
- 194 kmEdgewood3,069 people
- 196 kmHomestead Grays Bridge
- 196 kmHomestead2,884 people
- 197 kmGlenwood B&O Railroad Bridge
- 198 kmGlenwood Bridge
- 202 kmHot Metal Bridge
- 204 kmBrady Street Bridge
- 204 kmBirmingham Bridge
- 205 kmMount Oliver3,354 people
- 205 kmSouth Tenth Street Bridge
- 206 kmLiberty Bridge
- 206 kmPanhandle Bridge
- 207 kmSmithfield Street Bridge
- 207 kmPittsburgh302,971 people
- 207 kmWabash Bridge
- 208 kmFort Pitt Bridge
- 208 kmPoint Bridge II
- 209 kmOhio Riverat 216 m
Water level along the river (RiverATLAS; the height is exaggerated). Towns: GeoNames and Wikidata; bridges, dams and tributaries: Wikidata.
River in Pennsylvania and West Virginia, United States
At the mouth it carries 358 m³/s on average: an Olympic pool every 7.0 seconds. It drops from 267 m to 216 m, 0.2 m per kilometre on average. Its basin covers 19,011 km², about the size of FJ. 1.3 million people live in it. Highest water: from April to May; lowest: February. Dams and reservoirs hold back a large share of its water (11% of a year's flow).
Where to start
- PittsburghLargest city on its banks · 302,971 people
- Pittsburgh International Airport (PIT)Nearest airport with scheduled flights, 20 km from the cityCar hire at PIT airport (Pittsburgh)Discover Cars · Affiliate link↗
- On the water39 ferry piers, marinas, boat rentals and boat ramps along the river (OpenStreetMap)
- Kayak and canoe12 put-ins and rapids mapped (OpenStreetMap)
- From May to SeptemberThe best months to visit
Monongahela River, month by month
Highest water: from April to May
Lowest water: February. Best months to visit: from May to September.
From about 170 m³/s in the lowest month to 1,200 m³/s in the highest. An estimate: the monthly flow is modelled from the lowest and highest months of WaterGAP (RiverATLAS, 1971–2000) and the rain and snow along the river (WorldClim). Dams change the real rhythm. The chip is the average air temperature; below it, the month's rain.
Plan the trip
Plan the trip: boat trips, a bed by the river, a car
Some links above are affiliate links: if you book through them we may earn a commission, at no extra cost to you. It never changes what the data on this page says.
The basin
Monongahela River: the basin in numbers
18,992 km² of land send their water to this river. This is what lives on it.
- 1.3millionpeople live in the basin
- 72/km²people per km²
- 563maverage altitude of the basin
- 1,174mmof rain a year (basin average)
- 9.5°Caverage air temperature
- 5%protected areas
- 0.3%covered by lakes
- 1.3km³held in reservoirs
What covers the basin
- 90% Forest
- 14% Cropland
- 5% Pasture
- 4% Towns and cities
RiverATLAS (HydroATLAS v1.0, CC BY 4.0): land cover, people, protected areas, glaciers and dams over the whole basin upstream of the mouth.
Along the river
Monongahela River: what you find on the way
- 11WeirsOpekiska Lock and Dam, Hilderbrand Dam, Morgantown Dam and 8 more
- 42LocksOpekiska Lock, Hildebrand Lock, Morgantown Lock and 39 more
- 4WaterfallsLittle Falls, Thompson Run Falls and 2 more
- 1Rapids
- 11Canoe put-insElizabeth Launch, Port Vue Launch, Braddock Launch at 11th Street and 8 more
- 33Boat rampsBirdie's Landing (private), Public Boat Launch (Pa. Fish and Boat Commission), Braddock Public Ramp and 30 more
- 6MarinasSunset Marina, Greene Cove Marina, Engle's Holiday Harbor and 3 more
- 3River beachesAquatorium Beach Right Side, Aquatorium Beach Left Side
From OpenStreetMap, within 2.0 km of the river. Not mapped is not the same as not there.
Cross-checked with our atlases
Monongahela River in our other atlases
What our sister atlases know about the waterfalls on this river, the lakes it flows through, the beaches at its mouth, the mountains where it rises and the islands off its mouth.
 2mountains at the sourcePeakyas
Mountains at the source (2)
Within 15 km of the source, by Peakyas
- Browns Knob12 km away
- Kincaid Knob12 km away
From space
The source and the mouth, seen from orbit
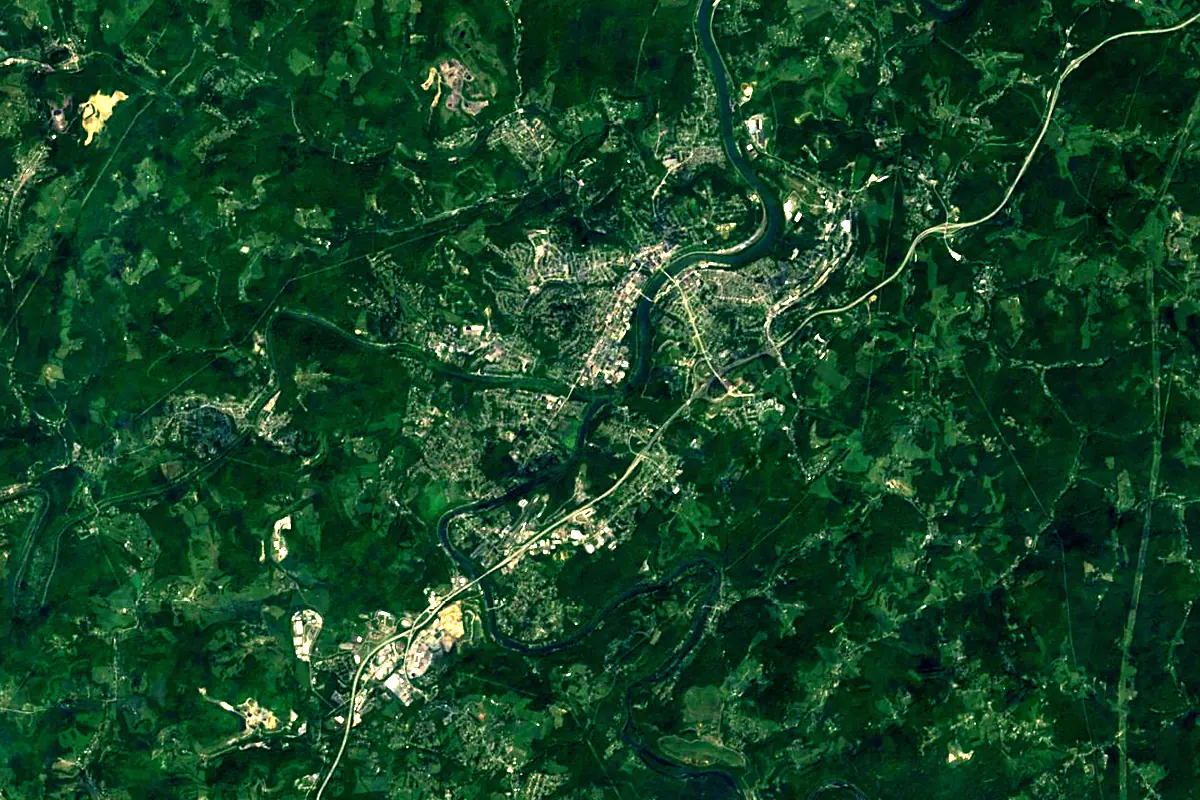
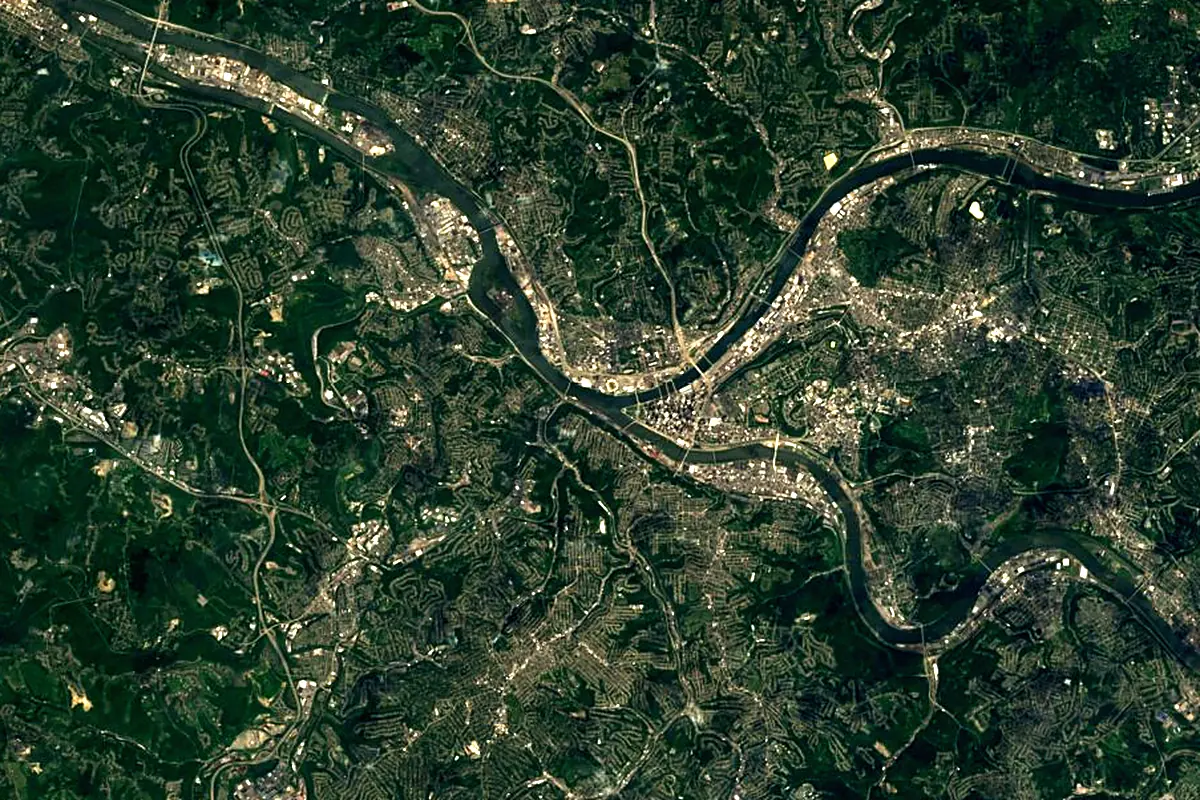
Sentinel-2 cloudless 2016 by EOX IT Services GmbH (contains modified Copernicus Sentinel data 2016), CC BY 4.0. The glowing line is the river as drawn by RiverATLAS.
Photos
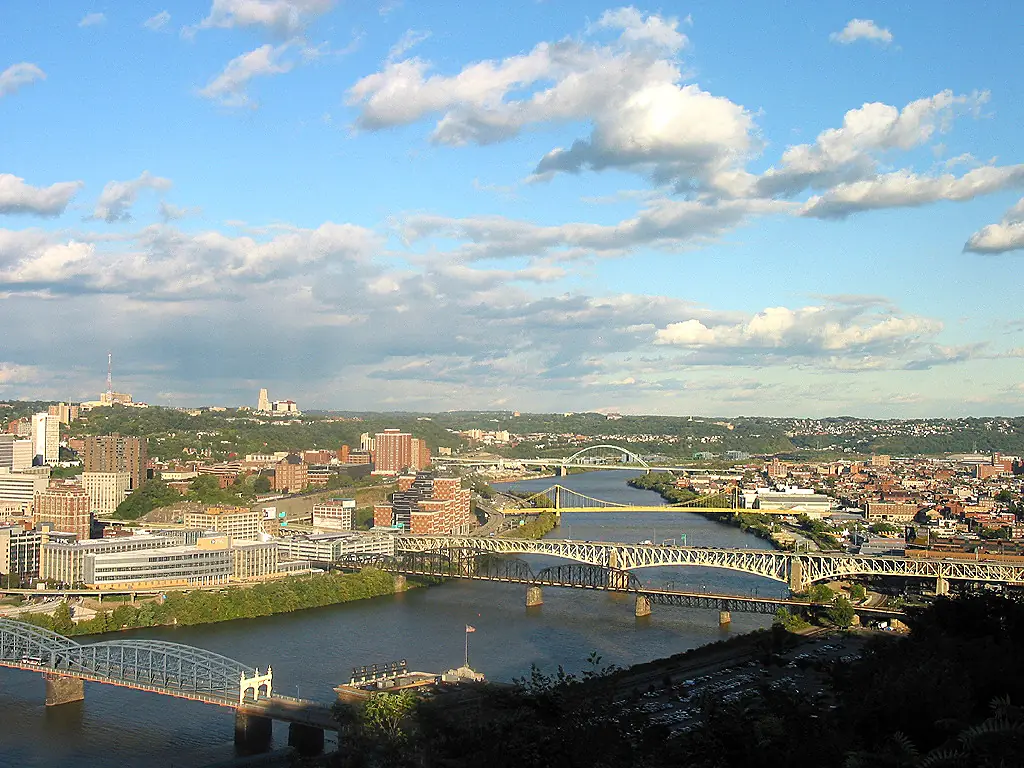
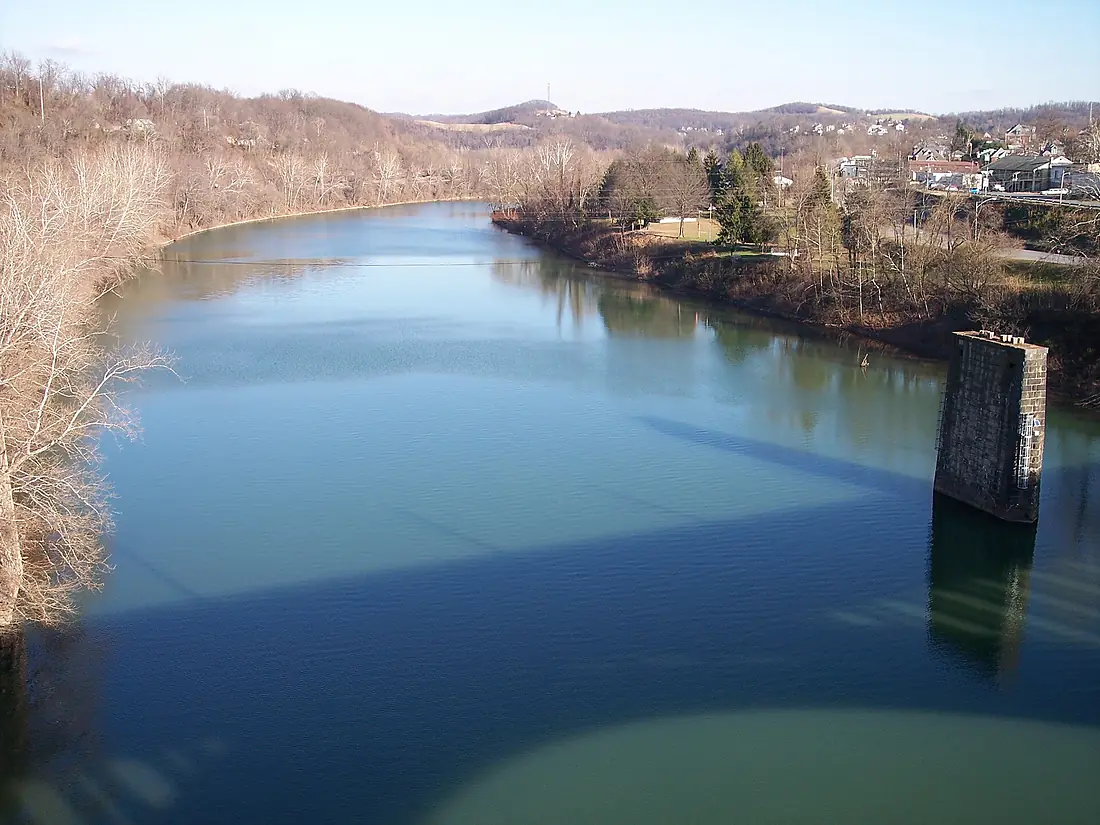
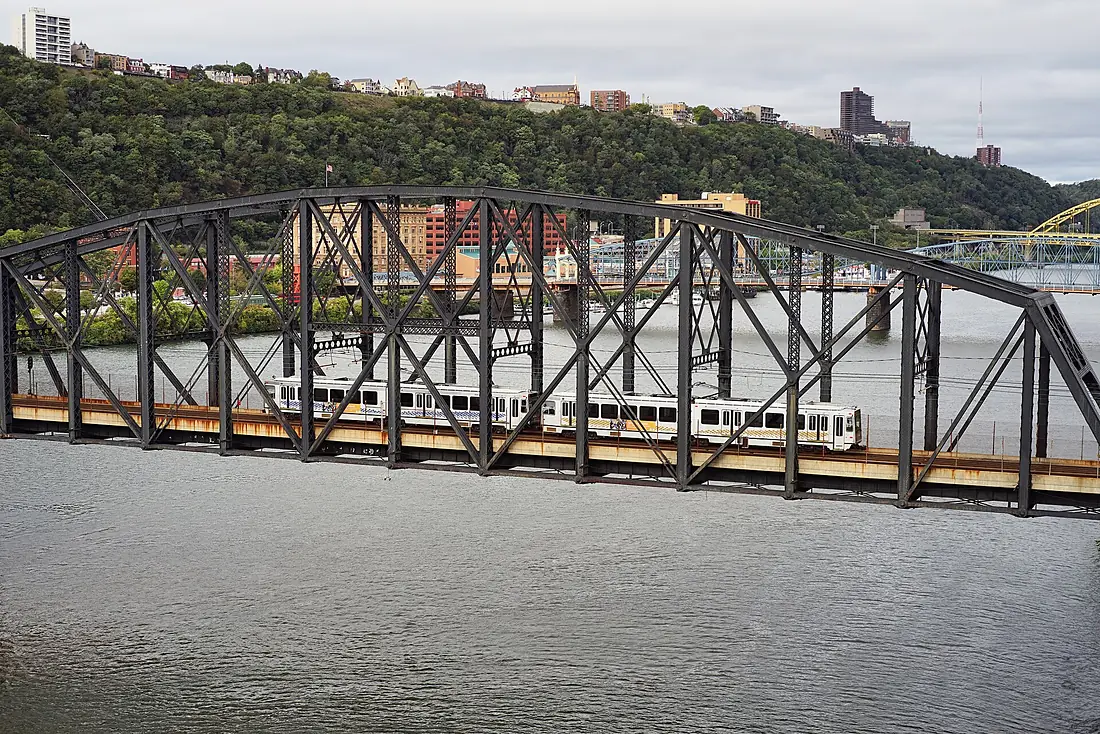
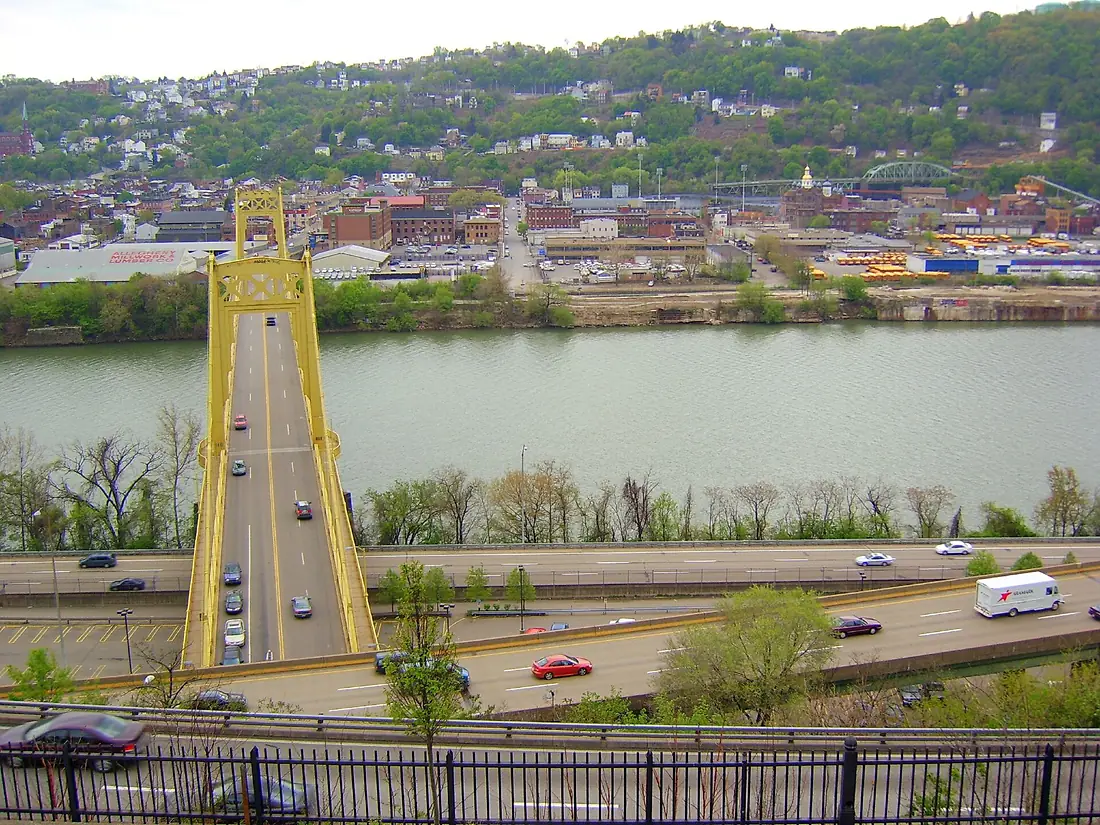
Monongahela River in pictures
Tributaries
Where it flows, and what flows into it
It flows into
Ohio RiverUnited States1,579 km8,000 m³/sTributaries (14)
Also: Youghiogheny River, Cheat River, West Fork River, Tygart Valley River, Turtle Creek, Peters Creek, Buffalo Creek, Crooked Run, Deckers Creek, Dunkard Creek, Redstone Creek, Streets Run, Cobun Creek, Tenmile Creek
In the same basin
United States3,766 km12,700 m³/sMissouri RiverUnited States3,726 km2,500 m³/sArkansas RiverUnited States2,364 km240 m³/sTennessee RiverUnited States1,049 km2,000 m³/sRed RiverUnited States2,189 km1,900 m³/sYellowstone RiverUnited States1,114 km390 m³/sPlatte RiverUnited States500 km200 m³/sCanadian RiverUnited States1,458 km200 m³/sIllinois RiverUnited States432 km660 m³/sAllegheny RiverUnited States523 km560 m³/sNearby
Rivers nearby
United States523 km560 m³/s0 km awayCuyahoga RiverUnited States137 km29 m³/s185 km awayShenandoah RiverUnited States241 km85 m³/s232 km awayKanawha RiverUnited States156 km430 m³/s255 km awayNiagara River Canada53 km5.8 m³/s325 km awayDetroit RiverUnited States45 km5.3 m³/s316 km awaySusquehanna RiverUnited States715 km1,100 m³/s348 km awaySt. Clair RiverUnited States65 km5,200 m³/s320 km away
Where these numbers come from
| Name, length, places | Wikidata (Q643780) · CC0 |
|---|---|
| Course, profile, basin | RiverATLAS v1.0 (HydroATLAS, Linke et al. 2019) · CC BY 4.0 — followed from the source to the mouth given by Wikidata |
| Flow | WaterGAP (RiverATLAS), 1971–2000 · CC BY 4.0 |
| Climate along the river | WorldClim (RiverATLAS), 1970–2000 · CC BY 4.0 |
| Towns, bridges, dams | Wikidata · CC0; GeoNames · CC BY 4.0 |
| Along the river | © OpenStreetMap contributors · ODbL |
| Images | EOX Sentinel-2 cloudless 2016 · CC BY 4.0; Wikimedia Commons |
| Our other atlases | Peakyas — Wikidata · CC0; © OpenStreetMap contributors · ODbL; GeoNames · CC BY 4.0; HydroLAKES · CC BY 4.0; NOAA OISST |
Every source and licence is on the data sources page.
The family
Do you prefer beaches, lakes, mountains, waterfalls, islands, rivers or canyons?
Same idea, other landscapes: field atlases built on open data, month by month, in seven languages.
 beaches
 Find your beach: sea temperature, sun and swimming month by month.Visit
  lakes
lakes Every lake on Earth: water temperature, ice, depth and the shore.Coming soonVisit mountains
 Every summit in 3D: summit weather, the 0 °C line, huts and trails.Visit
  waterfalls
 Every waterfall: height, flow month by month and when it roars.Coming soonVisit
  islands
 Every island from the sea up: size, sea temperature, ferries and 3D.Coming soonVisit
  rivers
 Every river from source to sea: the journey, the flow and the basin in numbers.You are here
 canyons
 Every canyon cut to scale: depth to the floor, rim and floor temperatures, trails and viewpoints.Coming soonVisit